Tag Archives: Identify

Identify #6: Dr. Andy McGraw

Identify is a monthly series here on the SAL blog, focusing on students, faculty, and alumni of University of Richmond who have used GIS in exciting ways. Come by each month to learn more about the interdisciplinary nature of GIS here at UR.

The ArcGIS App in action

Over the past year, the Spatial Analysis Lab has explored new uses for mobile GIS, including using the ArcGIS App to collect and analyze spatial data. That’s why were especially excited when Associate Professor of Music and ethnomusicologist Dr. Andy McGraw approached us and asked for help with an assignment he was envisioning.

Dr. McGraw taught two ethnomusicology-related classes this year: “Cultural Musicology” and “Soundscapes.” For these classes, Dr. McGraw wanted to elucidate “the relationship of sounds to [the City of Richmond’s] geography in a very specific way.” To achieve this goal, he instructed his students to leave the campus of University of Richmond and find sound and music throughout the greater Richmond area. Yet Dr. McGraw needed a good way for his students to record their findings: after all, sounds are inherently tied to a place, so knowing exactly where the students heard these sounds could contribute toward constructing this aural landscape of Richmond.

As a solution, we recommended having students use the ArcGIS App to collect data points while in the field. Dr. McGraw said he had heard of using GIS-based techniques to collect sound data before, but had never used GIS and did not know all that was possible—we were glad to introduce the technology to him!

To achieve his goal, we first used ArcGIS Online to create a blank map and then added an editable feature service hosted on our web server. The feature service not only allowed students to record their exact location on the map but also to input data related to that location, such as the place’s name, the type of sound present, or the decibel reading (a measure of “loudness.”) We also gave students the option to upload photos, videos, or sound files.

The students then journeyed into Richmond and found instances of sound and music. While there, they launched the App on their GPS-enabled smartphones and collected information about that place and the sound they were hearing. Moreover, as students added new points to the map, those points automatically showed up on everybody else’s devices. In short, the classes used live, crowdsourcing techniques based in GIS.

While both classes successfully and easily recorded locations of sound around Richmond, this project is far from over. Prior to undertaking any serious analysis, says Dr. McGraw, at least three years’ worth of classes will explore Richmond and collect sound and music data; these classes will build upon and add to the data collected this year. Dr. McGraw wants to allow so much time for data acquisition, he says, because it’s hard as of yet to see any specific trends, despite the hundreds of points collected by this year’s students—there still isn’t enough data.

To further increase the number of sound and music locations, Dr. McGraw hopes to teach other individuals outside of his own classes how to collect points with the mobile app: students in other classes at UR, citizens living and working in Richmond, and hopefully even students at Virginia Commonwealth University. Truly, Dr. McGraw is undertaking a community project; our GIS infrastructure is ready to support a variety of users.

Finally, once Dr. McGraw and his students can start identifying trends, they hope to display the fully interactive maps on touch-screen video monitors in Booker Hall of Music on the UR campus. The Spatial Analysis Lab looks forward to helping Dr. McGraw over the next few years as he works on this project, and we will always be looking for ways to improve and supplement the sound maps so as to reveal as many insights as possible!

Identify #4: Dr. Jory Brinkerhoff

Identify is a monthly series here on the SAL blog, focusing on students, faculty, and alumni of University of Richmond who have used GIS in exciting ways. Come by each month to learn more about the interdisciplinary nature of GIS here at UR.

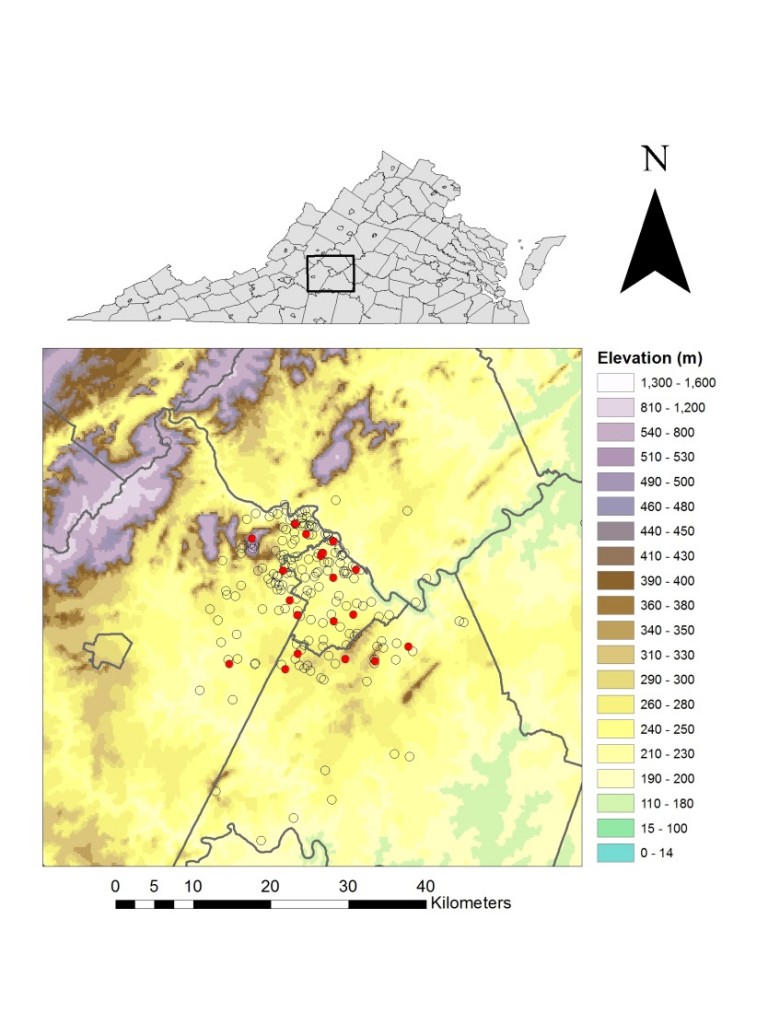
Lyme disease in dogs in Lynchburg, VA

Dr. Brinkerhoff and his students created this map showing Lyme disease presence in dogs near Lynchburg, Virginia.

Undeniably, one of the University of Richmond’s most popular majors is Biology. Yet the University recently created a new, related major called Healthcare and Society which is quickly rising in popularity. The Healthcare and Society major teaches students how to understand and examine “the business, legal, ethical, interpersonal, and sociopolitical aspects of healthcare delivery, finance and organization,” says the University. As a result, the Spatial Analysis Lab has seen many students taking GIS classes because they want to learn how to tie together spatial analysis with global health.

Biology professor Dr. Jory Brinkerhoff has helped usher in this new interest in health-oriented GIS. He teaches a popular course titled Eco-Epidemiology which serves as an elective class for both the Biology and the Healthcare and Society majors. Dr. Brinkerhoff writes the following about his GIS-informed research:

Researchers have long studied the intersection of geography and disease; as any epidemiology student can affirm, arguably the first epidemiological study was done to identify spatial clusters of cholera in London in the 1850s. The reason for the association between these two disciplines is straightforward: people want to know exactly where they might face exposure to a nasty disease, both now and in the immediate future. Just as the first epidemiologists were fascinated by patterns in time and space, modern epidemiologists spend much of their time thinking about the same phenomena. However, although many questions about disease have remained unchanged for centuries—who? what? where?—our capacity to explore disease pattern and process has developed substantially.

I personally think that investigating and mapping disease risk is one of the most exciting aspects of public health research. As an ecologist, I am trained to look for patterns in time and space. As an epidemiologist, I look specifically for patterns that shed light on factors that affect someone’s chance of being exposed to or contacting disease.

My current research focuses on Lyme disease and how its spatial distribution in Virginia is changing. My students and I approach this problem from lots of different angles: we use field sampling, analysis of human case data, molecular genetics, and immunological assays to figure out where risk to this disease is highest. In a recent project, two of my senior class students collected and mapped canine blood-test data to determine if there were any elevational patterns that might explain Lyme disease risk in dogs (yes, dogs can get Lyme disease, too!) These students used GIS to digitize and georeference a binder’s worth of positive and negative test result data for Lyme disease as collected from a veterinary clinic in Lynchburg, Virginia.

We then used a geo-statistical test to see if variation in elevation is associated with exposure to this tick-transmitted disease. In the map [see above], positive test results are indicated by red circles and negative test results are indicated by open (hollow) circles. Our preliminary results suggest that dogs—and probably humans—that live at higher elevations are at increased risk of exposure to Lyme disease. This finding is especially important for the Lynchburg area, as that major city lies near the base of the Appalachian Mountains. Interestingly, our analysis of field data for human cases suggests the same result—keep this in mind the next time you head up to the mountains for a hike!

The Spatial Analysis Lab thanks Dr. Brinkerhoff for writing about his research for our blog. We look forward to helping Biology and Healthcare and Society students as they continue their epidemiological research!

Identify #3: Taylor Holden ’15 and Austen Kelso ’15

Identify is a monthly series here on the SAL blog, focusing on students, faculty, and alumni of University of Richmond who have used GIS in exciting ways. Come by each month to learn more about the interdisciplinary nature of GIS here at UR.

Sample map from Holden and Kelso's research

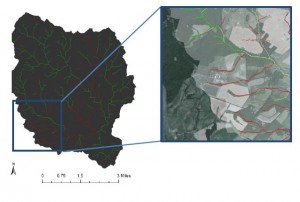
One of the final maps produced by Holden and Kelso. Flow paths colored in red contribute more to the runoff in the Chesapeake Bay than do flow paths colored in green.

The Spatial Analysis Lab is an active place throughout the academic year—especially as we approach the end of the semester with students working diligently to finish their projects! But the SAL doesn’t remain dormant during the summer, and in fact stays equally active, thanks to the students who pursue geography- and environmental studies-related summer research.

Taylor Holden ’15 and Austen Kelso ’15 were among the students conducting research this previous summer. Working with their advisors, UR Geography professor Dr. Todd Lookingbill and Jeffrey Allenby of the Chesapeake Conservancy, these two students carried out a novel research project to determine locations of concentrated flow paths and their relative importance to water pollution in the Chesapeake Bay.Under the Clean Water Act, localities whose water runoff feeds into the Chesapeake Bay have to meet daily requirements for the maximum amount of nutrients and pollutants allowable in runoff, known as the “total maximum daily load”. Attaining these goals can be challenging, since localities not only have to identify major sources of water pollution but also must find ways to curb that pollution. Allenby recently wrote a procedure to achieve this end, and it was this procedure that Holden and Kelso carried out.

Using high-resolution aerial photography from the National Agriculture Imagery Program, Holden and Kelso first analyzed some small watersheds in Central Virginia. They then used an advanced remote sensing program called ENVI to classify these aerial images by various land cover types. This produced a raster image, similar to the National Land Cover Database rasters but with much more detail, that they could bring into ArcMap. Separately, they used precise digital elevation models and a specialty ArcGIS toolbar called TauDEM to find locations of concentrated flow paths, the exact places where runoff flows over land. Often these were permanently-existing streams, but the tool could also find ephemeral flow paths that lasted only during a rain storm, for instance.

Holden and Kelso then overlaid the flow paths with the land cover data in ArcMap. Presuming that certain land cover types (such as tilled agricultural land or impervious surfaces) contribute to nutrient runoff loads more than other land cover types (dense forest, for instance), they weighted the land cover types accordingly and intersected those weights with the flow path locations. Their resulting map of flow paths showed exactly where large amounts of pollutants were entering the watershed, and thus which exact parcels of land could be the best targets for pollutant remediation. Rather than trying to remedy runoff problems along all the many miles of flow paths in the Chesapeake Bay watershed, this method allows agencies to focus their efforts on specific, high-benefit areas.

For Allenby and the Chesapeake Conservancy, this analysis was a proof of concept: not only that the method could successfully identify areas with disproportionately high quantities of pollution runoff, but also that college students could carry out this high-level analysis. Since then, the Chesapeake Conservancy has started to work with other universities throughout the Chesapeake Bay watershed in carrying out similar analyses.

For the two students, this project was rewarding, even though it was often challenging. Kelso, for instance, said learning how to use new software and new techniques were among the hardest aspects; “not only did we have to learn how to use these new softwares, but we had to learn them thoroughly enough to use them effectively and accurately to complete the project.”

But the rewards came from realizing that this project had real community value. “A lot of [academic] classes focus on large scale concepts,” said Holden. “But with this project we could look within a neighborhood.… This made the project feel so applicable because it was on a scale [where] we could potentially have a measurable impact.” Kelso agreed, adding, “I found this project to be very exciting because … our results would be used in real life decision-making processes in the Chesapeake Bay watershed.… It was a good reminder that what I am learning has useful real world applications.”

The Spatial Analysis Lab looks forward to continue working with the Chesapeake Conservancy, both to further this project for other local watersheds and to assist in future research projects. Such work demonstrates that while the SAL may be a great University of Richmond resource, its benefits extend far beyond our campus boundaries.

Identify #2: Dr. Carrie Wu and Megan Sebasky ’10

Identify is a monthly series here on the SAL blog, focusing on students, faculty, and alumni of University of Richmond who have used GIS in exciting ways. Come by each month to learn more about the interdisciplinary nature of GIS here at UR.

Wu and Sebasky at the Evolution 2010 Meeting

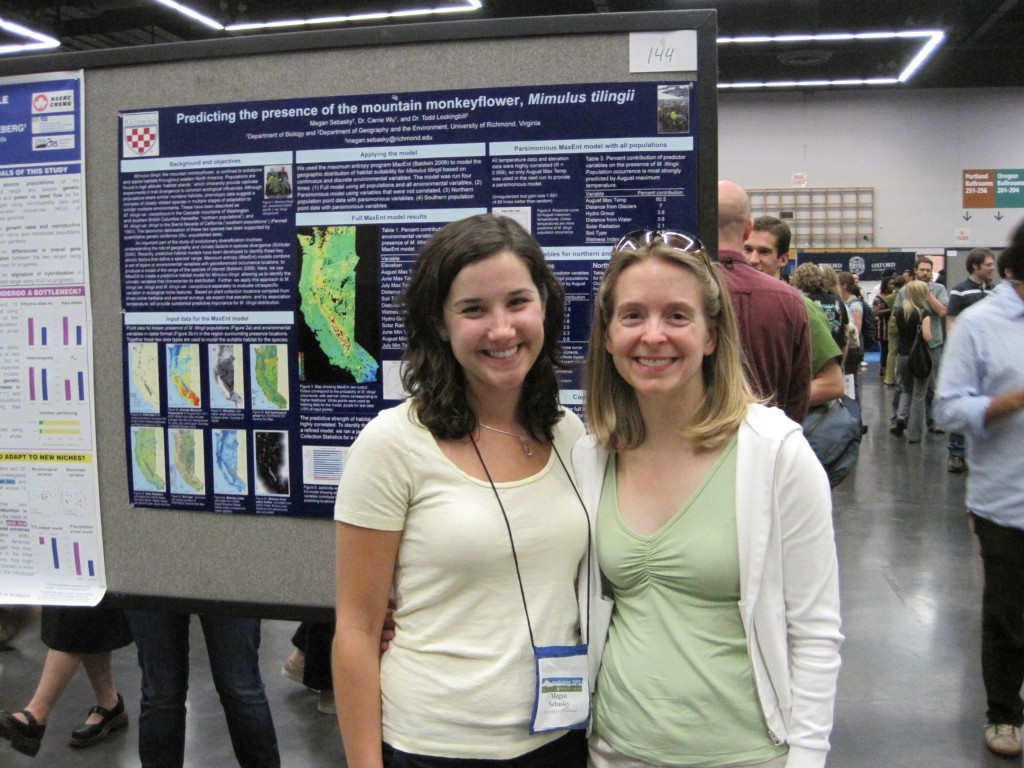
Megan Sebasky ’10 (l) and Dr. Carrie Wu (r) at the Evolution 2010 meeting presenting their ecological niche modeling research.

The University of Richmond prides itself on offering plenty of opportunities for undergraduate students to perform rigorous research alongside one of the University’s excellent faculty members, many of whom are experts in their fields. Often, these undergraduate research experiences help students determine their future endeavors and offer them a chance to have their name on published material soon after college. Megan Sebasky ’10 not only took advantage of undergraduate research by working with Dr. Carrie Wu, Assistant Professor of Biology, but also used her GIS expertise to further the value of her research.

Sebasky majored in biology and environmental studies; while a rising senior, she joined the lab of Wu, who had recently been hired at the University of Richmond after working at Duke University. At the time, Wu was working on research focusing on the plant species Mimulus tilingii, commonly referred to as the mountain monkey-flower. Sebasky mentioned she had GIS experience, thanks to the classes she took here in the Spatial Analysis Lab, which immediately attracted Wu’s attention: Wu’s research about the mountain monkey-flower contained a strong geographic component, one which would immensely benefit from GIS.

In particular, prior research had indicated that there may be two separate sub-species of Mimulus tilingii, one located primarily in Oregon and Washington, and another found further south in California. One approach Wu had identified to test whether there were actually two species involved ecological niche modeling, or using spatial information about environmental variables to determine the exact ecological conditions a species needs to thrive. If Wu and Sebasky were able to determine that the two presumed sub-species required different environmental conditions, they would have strong evidence to conclude that these sub-species were indeed taxonomically different.

MaxEnt output for mountain monkey-flower

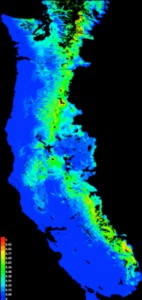
An output map from MaxEnt, showing the predicted occurrences for the mountain monkey-flower as a whole.

Sebasky conducted her side of the research by using ArcGIS as well as software called MaxEnt, which is among the most popular pieces of software for ecological niche modeling. Using the heat maps produced by MaxEnt, Sebasky and Wu determined that not only was the mountain monkey-flower ecologically divergent from its nearest relative, but that there were two distinct groups whose ranges split near the California / Oregon border. In addition, they found that cold temperatures were especially important for delimiting the ranges of the two sub-species. Armed with this new knowledge, they traveled in 2010 to the Society for the Study of Evolution’s annual meeting, which was held that year in Portland, Oregon, to present their findings. A full write-up of the research is forthcoming.

This success would not have been possible without Sebasky’s experience in GIS. While Wu was familiar with GIS, she admits to learning a lot more from Sebasky; since then, Wu has encouraged other students to pursue research projects with GIS components and to take the GIS classes offered at the University of Richmond. “Even when I go to professional meetings [for biology],” Wu says, “[GIS] is coming up more and more. … It’s not just one little corner anymore.” And like any good academic, Wu hopes to continue to learn more about GIS as she continues throughout her research career.

As for Sebasky, the great experience she had with her undergraduate research led to her present educational endeavors. Currently a Master’s student at the University of Virginia, Sebasky is continuing to work on GIS-informed ecological niche modeling, looking at an invasive species from Europe now found in the United States. Says Sebasky, “In grad school, I have found that ecological niche modeling has become extremely popular in the literature and being able to do it is an extremely helpful skill set to have. I have been doing a lot of networking at conferences … and people are really interested in what I’m doing.”

Here at the SAL, we are glad to see our alumni achieve these great accomplishments and know that the strong GIS foundations they received as undergraduate students help them to reach these outcomes. And we will continue to support our phenomenal faculty in Biology, and indeed all the academic departments, as they find ways to enhance their research with GIS!

Identify #1: Justin Madron

Identify is a new, monthly series here on the SAL blog, focusing on students, faculty, and alumni of University of Richmond who have used GIS in exciting ways. Come by each month to learn more about the interdisciplinary nature of GIS here at UR.

The DSL's Paullin Atlas

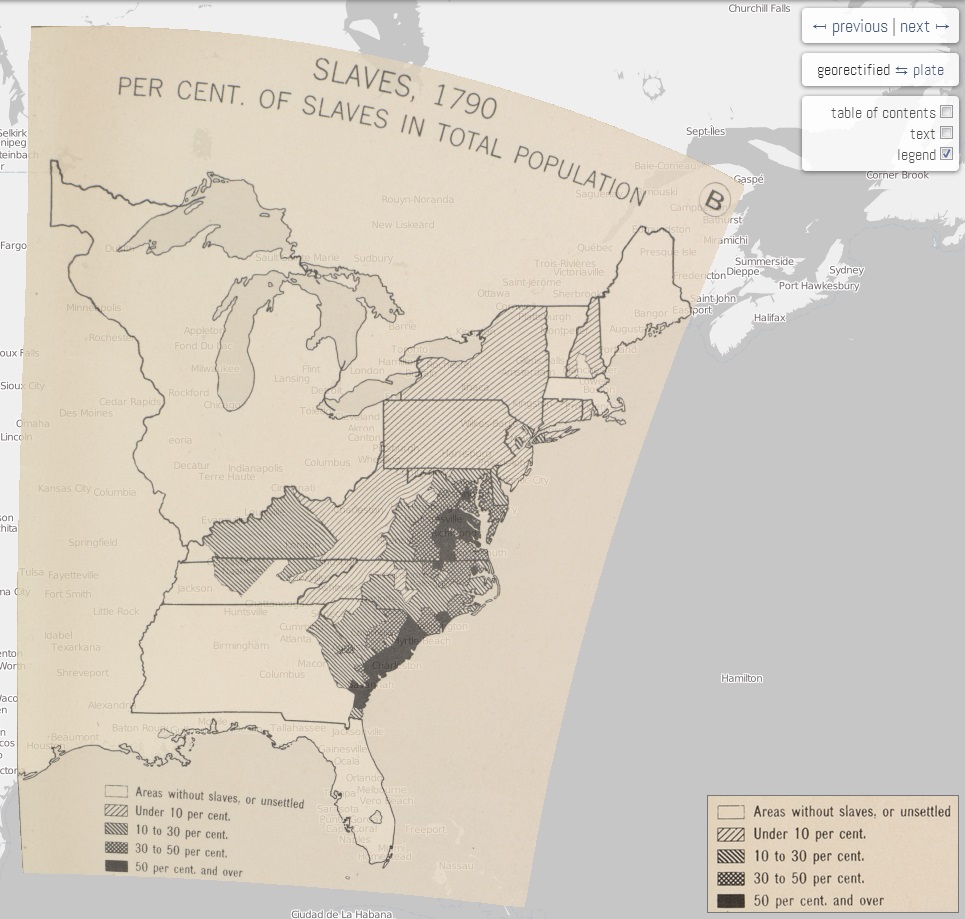
An early glimpse at the DSL’s Paullin Atlas project.

Over the last few years, the University of Richmond has greatly increased its GIS presence on campus. Not only has the Spatial Analysis Lab become an even more active place, but various University departments have hired full-time GIS staff. Among these new hires is Justin Madron, the GIS Analyst for the Digital Scholarship Lab (DSL). Madron, who got his Master’s degree this previous spring from Virginia Commonwealth University after receiving his Bachelor’s degree from West Virginia University, has been learning about GIS since his junior year at WVU.

While at VCU, Madron got an internship to work with the University of Richmond and professor Dr. Todd Lookingbill on a project to create a Natural Resource Condition Assessment for Petersburg National Battlefield. During the internship, he continued to hone his GIS skills and simultaneously became familiar with the UR environment and the geospatial resources available here. When he graduated in May, he knew he wanted to continue in GIS; after all, he says, “that’s why I went to graduate school.” Thanks to his connections here at UR, he heard about a new position in the DSL and applied for the job.

Madron began in July and since then has been hard at work with a few mapping initiatives. First has been a project to digitize Charles O. Paullin’s Atlas of the Historical Geography of the United States. This comprehensive atlas, first published in 1932, contains nearly 700 detailed maps of the early United States, looking at both physical and human geographies. The DSL’s project, which they aim to finish by the end of this autumn, digitizes these maps to view via an online interface, animates them to show changes over time, and makes them interactive, so that users can click on states or counties to see specific data for that area. The Spatial Analysis Lab has already been offering some assistance to Madron and the DSL with this project, beginning to form a knowledge- and data-sharing relationship between these two departments.

But the Paullin Atlas project is a sort of “warm-up” for the DSL’s bigger project. In January, the DSL was awarded a three-year, $750,000 grant from the Andrew W. Mellon Foundation to establish a comprehensive digital atlas of American history. With Madron’s help, the DSL will create two volumes of the atlas out of an eventual planned ten; the first volume will focus on migration, communication, and transportation, while the second will focus on the environment. The Spatial Analysis Lab will be contributing to this project as well, hopefully hosting the DSL’s data on our data servers, in an effort to have even better data sharing across various departments.

Madron is excited to work on these projects and is evidence that experience in GIS can land people unique and cutting-edge jobs. “GIS has opened a lot of doors for sure,” says Madron, “and it is fun.” Look for more updates from the DSL’s mapping projects on their website or here on the SAL blog!