The Nuclear Club

The Nuclear Club is a radical map that focuses on mapping the possession of nuclear weapons in the world. It was produced in 1981 as part of the Pluto Project that started by a radical British publishing houses known as the Pluto Press, which aimed to promote radical social changes. The Nuclear Club is a radical map because while condemning the war and destructive powers, it also attacks traditional ideas of maps by abandoning all the features of conventional maps and focusing on expose cartographers’ value of the society, politics, and war to the surface.

This map reveals cartographers’ intention of emphasizing the role of central Europe in the Cold War and criticizing the use of nuclear power. The bold and vibrant colors and the bomb icons highlight the tension of the Cold War. Moreover, The Europe centered projection and the magnified area of Europe reflect that the conflict between the superpowers and the nuclear weapons were threatening European countries.

By constructing The Nuclear Club and other maps in the Pluto Project, the group showed their attention on protesting against states’ enormous power during the climax of the Cold War and after it as well as so-called objective, scientific and realistic maps.


Posted in Uncategorized | 1 Comment

Atlases of the Week: National Geographic Kids Beginner’s World Atlas

Not all atlases are for serious professional and academic studies. Atlases like the Kids Beginner’s World Atlas can provide up to date information while being amusing, interesting and easy to understand. This atlas is designed for children ages 5 to 8, who have just started to explore the world. It uses vivid pictures, various icons, bold colors, and succinct expression to explain the humanity and nature to the kids. As a teaching material for early education, this world atlas can help to establish a stable foundation for further education.

Posted in Atlases of the Week | Comments Off on Atlases of the Week: National Geographic Kids Beginner’s World Atlas

Team Map Presentation – “The World Distribution of Spirochetal Disease”


The World Distribution of Spirochetal Diseases map was produced during the 1960s by the American Geographic Society. This map was part of a series of maps that were created in order to sort and map out the Third World. During the publishing of this map, the United States was involved in the Cold War, hence the complete blockage of Americas biggest rival, the USSR. While there is clearly an influence of the Cold War on this map, America’s political agenda is also expressed. Around this time President Harry S. Truman launched the Point Four program, whose main goal was to implement scientific and industrial advancements into third world countries.

Although this is a scientific map, it does show how American’s influenced the identities of these third world countries. This map displays third world countries such as Africa and Thailand as disease filled which legitimizes a fear within the American people who view this map. It makes America look like a place of health and no disease while these third world countries are the complete opposite. There are sub-maps and sub-legends along the borders of the map that allow for more information to be displayed on the geography and environment, making the cartographic projections more detailed.

Posted in Uncategorized | Comments Off on Team Map Presentation – “The World Distribution of Spirochetal Disease”

Atlas of the Cold War

This historical atlas introduces 50 maps about Cold War, including popular events like Cuban Missile Crisis and the Berlin Blockade with easily understood synopsis for each. The more interesting contents the author also presents are the themes such as cultural issues for the readers to understand the complexities of Cold War.

Posted in Uncategorized | Comments Off on Atlas of the Cold War

ALL OVER THE MAP

http://news.nationalgeographic.com/all-over-the-map/

 All Over The Map tells stories about past, present, and the future cartography. It is run by Betsy Mason, Greg Miller and a group of science journalists who love maps. They write the blogs with wired but interesting maps like secret Cold War military mapsmaps for self-driving cars, or maps of other worlds.

Posted in Uncategorized | Comments Off on ALL OVER THE MAP

Map of Korean Airlines Flight 007

“An act of barbarism, born of a society which wantonly disregards individual rights and the value of human life and seeks constantly to expand and dominate other nations, ” President Reagan called it. This shootdown of Flight 007, a Korean Airlines Boeing 747 ariliner in 1983, resulted in the human losses of 269 from over sixteen countries, including a Representative from George in the United States House of Representatives.

The year 1983 is the turning point of the USSR’s breakdown. After this, the public sided with the US and against the USSR. It is essential for us to know why this shootdown is so important at that time. By discussing the previous history, the aftermath, the map itself, and the timing of the map’s release, we will look deeper into the Cold War chronologically.

Prior to this incident, there were already trends estimating that USSR was losing the Cold War. Only several months later, President Reagan announced a missile system plan to protect US land-based missiles. This caused a panic among USSR leaders, so to counter the fear, SSIR set up a new intelligence effort called RYAN to gather information about US. This time was highly sensitive for SSIR in both international relationships and military preparations. In the perspective of the Soviet Union,  the intrusive airliner is the target to be rightly destroyed when it was questioned as an airplane to perform intelligence mission.

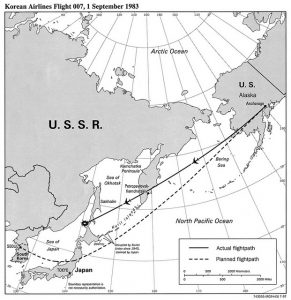
After the shootdown, instead of presenting the objective fact to the public, like how did an experienced Korean pilot deviate from the route and run into the prohibited airspace without warning, the United States seized the opportunity to condemn and isolate USSR by emphasizing the human losses.  First, the U.S. released a substantial amount of highly classified intelligence information for a propaganda advantage. Then, the U.S. had one press conference to deliver the details of the shootdown, some of which were challenged by the Soviet Union. On September 6, 1983, the U.S. ambassador to the UN Jeane Kirkpatrick presented the event using the map and audio tapes of the Soviet Union’s pilots. That was when the people confirmed the shootdown of Korean airplane 007 for the first time.

We can look at the map to understand the process of this shootdown. However, what we see here is distorted. The most prominent distortion is the magnification of the territory of the USSR, which is five times the landmass of the US while all the irrelevant nations are ignored. In this sense, the map is trying to amplify the threat posed by the USSR to the peace of the whole world, while the US is just the victim and witness in this event, just like the other countries. Besides that, because the relative landmass of the US and USSR is changed disproportionally to fit in a single paper, we cannot tell for sure that the angle between the planned flightpath and actual flightpath is precise. A great chance is that the creator made those two routes much closer than they were so that people looking at this map would say that the Soviet Union overreacted to the simple mistake of a pilot. Also, to show that the pilot barely trespassed the territory, the actual route indicated by the black solid lines is drew to touch only a small portion of the islands (Sakhalin and Petropavlovsk Kamchatskiy) that belonged to the Soviet Union. Likewise, the symbol of the shootdown is also a clever choice. Rather than just a dot, the creator chose a sign of explosion to emphasize the destruction of the airplane, which signaled a warning for the possible war. Through all those little “tricks”, the USSR was portrayed as a merciless devil slaughtering anybody that might offend itself.

Not until 1997 did the United Nations released the map of this accident to the public. The release of the map after several years from 1983 also proves that the maps serve certain interests of United States Government. As the map shows, it is a simplified CIA map produced by a CIA employee and funded by United States Government. By postponing the release, the US might be able to direct the public opinion as it wanted since there was no evidence to prove against. After all, if the map came out right after the accident, the public would probably understand this is not a premeditated slaughter but an accident out of negligence, interfering with the objectives of the US to stir up an anti-Soviet drama.

Talking through the history and the presentation of this map, we can say that the maps are always biased to certain extent. They manipulate the thinking of the audience to serve the interests of the map creators, just like what you can see in this accident, the U.S. has used the map along with other strategies like propaganda to turn the world against the Soviet Union.


Reference:

[1]Fischer, B. (2007, March 19).  A cold War Conundrum. https://www.cia.gov/library/center-for-the-study-of-intelligence/csi-publications/books-and-monographs/a-cold-war-conundrum/source.htm#HEADING1-12

[2]Wood, Denis, and John Fels. The Power of maps. London: Routledge, 1993.[3] Craig A. Morgan, e Downing of Korean Air Lines Flight 007, 11 Yale J. Int’l L. (1985). Available at: http://digitalcommons.law.yale.edu/yjil/vol11/iss1/12

[3] Wikipedia contributors. (2018, March 24). Korean Air Lines Flight 007. In Wikipedia, The Free Encyclopedia. Retrieved 22:30, March 25,2018, from https://en.wikipedia.org/w/index.php?title=Korean_Air_Lines_Flight_007&oldid=832184941

[4]“FS2004 – Target Is Destroyed (Korean Air Lines Flight 007).” Edited by Allec Joshua Ibay, YouTube, YouTube, 30 Sept. 2016, www.youtube.com/watch?v=DK_PS9QFPFw.

[5]CoolBen, Admin. “The Downing of KAL Flight 007.” Association for Diplomatic Studies and Training, adst.org/2014/03/the-downing-of-kal-flight-007/.

[6]Gordon, Michael R. “Ex-Soviet Pilot Still Insists KAL 007 Was Spying.” The New York Times, The New York Times, 9 Dec. 1996, www.nytimes.com/1996/12/09/world/ex-soviet-pilot-still-insists-kal-007-was-spying.html.


Posted in Uncategorized | 1 Comment

Atlas of Cursed Places

This unusual atlas includes 40 different locations all over that world that are reported to be filled with disaster, chaos, paranormal activity, and death. It gives detailed descriptions of the history of these areas as well as how to get to them. Serving as a travel guide as well as an atlas, it would be useful to those interested in visiting these daunting areas.

Posted in Uncategorized | Comments Off on Atlas of Cursed Places

Johnathan Crowe’s Map Blog — The Map Room

http://www.maproomblog.com

Johnathan Crowe’s map blog is an interesting one that has been going on for more than 8 years. It includes both antique maps as well as the latest in geospatial technology. It gives us a glimpse of how cartography has changed throughout the years. He does not offer super detailed analysis of these maps but offers us a lot of intriguing maps to look at.

Posted in Uncategorized | Comments Off on Johnathan Crowe’s Map Blog — The Map Room

Where’s the Equality?

America is known as the land of opportunity, and to an extent this holds true. While it is a country of great education and many chances, there are some parts of the U.S. that are poverty stricken. Through varying shades of blue and distinctive shapes, this map reveals student poverty within the 13,000 plus school districts in the year of 2013. This simple and easy to understand map was created by the organization EdBuild. The map’s focus, only on U.S. school districts, provides us with a narrow view of American education. It is helpful in providing information such as how education funding is being allocated in America as well as displaying American values on the educational system. However, the map can be problematic because it does not reveal the causes of this inequality and poverty which is essential to understand the entire issue. The purpose of EdBuild’s map is to highlight the division within the counties educational system and to spark activism to combat this issue within the nation.

Off the bat, it is clear that the southern half of the United States is much more poverty stricken than the north when it comes to students’ education. The increased poverty levels are most likely due to the fact that a lot of public-school districts receive funding through local property taxes. This creates an unequal between property values of rich and poor districts. It causes the wealthier school districts to obtain better resources and opportunities, while the poorer districts remain inadequate or not up to par. One of the reasons student poverty is more prominent in the south may be due to a lot of the property up north being worth more money. An influential factor that explains why the south is so “poor” can date all the way back to the Civil War. The south was so set on investing in slaves while the north invested in machinery and technological advances. So, post-Civil War the south had cities in ruins, lost a majority, if not all of their slaves, leading to a depleted economy (Zandt). Fast forward to more recent years, the south continued to lag behind the north in regard to economy, explaining why there are more impoverished areas within the south.

The author chooses to use a map because maps offer a ton of information that other tools, such as a graph, could not. Maps can provide statistics and clear-cut visuals that make it easier to take in information. For example, it would be complicated to graph the percentage of school poverty in every school district, but a map can show all of this through different elements such as icons, colors, legends, etc. This specific map provides us with informational visuals of school districts within America. This is possible because the author has the power to decide what to include and what not to include on the map. The author was able to distinctly separate each school district within every state while giving us a close approximation of the percentages of poverty within each district. This puts the focus on America and is helpful in understanding school poverty. Going back to the author’s power to pick and choose what to put, the author of this map made sure it was very zoomed in on American education only. It remains silent on global education even though that is also a big issue. Schools in poverty in America do not compare to those in different countries.

While being very informative, maps can also be very influential. This map is a prime example. The creators of this map not only want to highlight inequalities within the educational system but want to spark a sense of activism within the viewers. They want people to push for equality or do what they can to help. According to the legend on the map, there are many areas where school districts have greater than 40% of student poverty that is right next to a school district with 0% to 10% of student poverty. To put things into perspective, a student who goes to school in a district with greater than 40% of student poverty will receive an inadequate education with very limited resources. On the other hand, a student who goes to school in a district with 0% to 10% of student poverty will receive a much better education and will be provided with much more resources, such as laptops, iPads, better teachers, more food options, etc. The authors of this map want people to push for reformation of the educational system and for the government to dedicate more money so that schools across the country will be equal. Less student poverty means more opportunities in the future and better education for children.

As someone who has experienced both ends of the spectrum in American education, I can attest that there are definitely inequalities in rich and poor areas. Also, I can say that if my family kept me in the poorer schools, I probably would not have gotten into college. This map is also a couple of years old, so I think that if a map of the same information were taken today it would be much different. Considering that our current Secretary of Education, Betsy DeVos, is trying to cut down Education Department funding (Johnson), there may be more school districts that will have a darker shade of blue. While there are many different ideas and underlying messages that can be pulled from this map, one thing is for certain, this map is pushing for action to be taken in order to fix our educational system and make it more equal no matter if students are poor or rich.

Works Cited

Alyson Zandt. “What Went Wrong with the South?” Facing South, 9 June 2016, www.facingsouth.org/2015/11/what-went-wrong-with-the-south.html

Johnson, Stephenie, et al. “Trump and DeVos Continue to Undermine Public Education with Their Proposed Fiscal Year 2019 Budget.” Center for American Progress, 12 Feb. 2018, www.americanprogress.org/issues/education-k-12/news/2018/02/12/446423/trump-devos-continue-undermine-public-education-proposed-fiscal-year-2019-budget/.


Posted in Maps of the Week | 2 Comments

Wiley and National Geographic College Atlas of The World

This atlas provides information on 25 themes, mostly environmental. It ranges from plate tectonics, to energy sources and population, all the way to conflict and terror. It is interesting because it correlates to the Ford Foundation and the wide array of programs the Foundation donated to. This atlas has over 55,000 named places the reader can look up in the index. Customer reviews also stated that the map has global themes dealing with energy, the environment, nuclear weapons, and politics.

Posted in Uncategorized | Comments Off on Wiley and National Geographic College Atlas of The World