
Map Link: www.sciencedirect.com/science/article/pii/S2352827321001154
The first map depicts the average increase in life expectancy since 2014, second shows the percentage of population that votes republican.
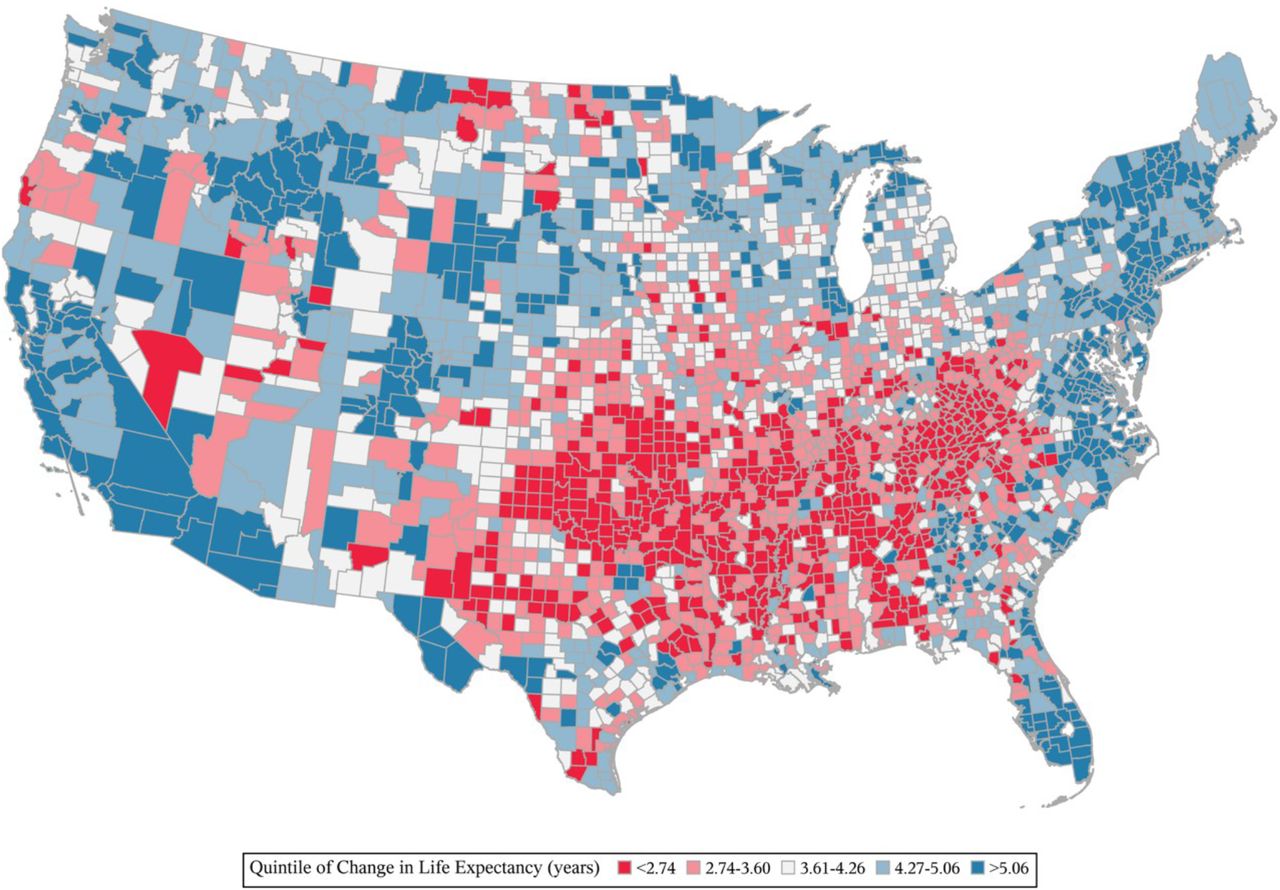
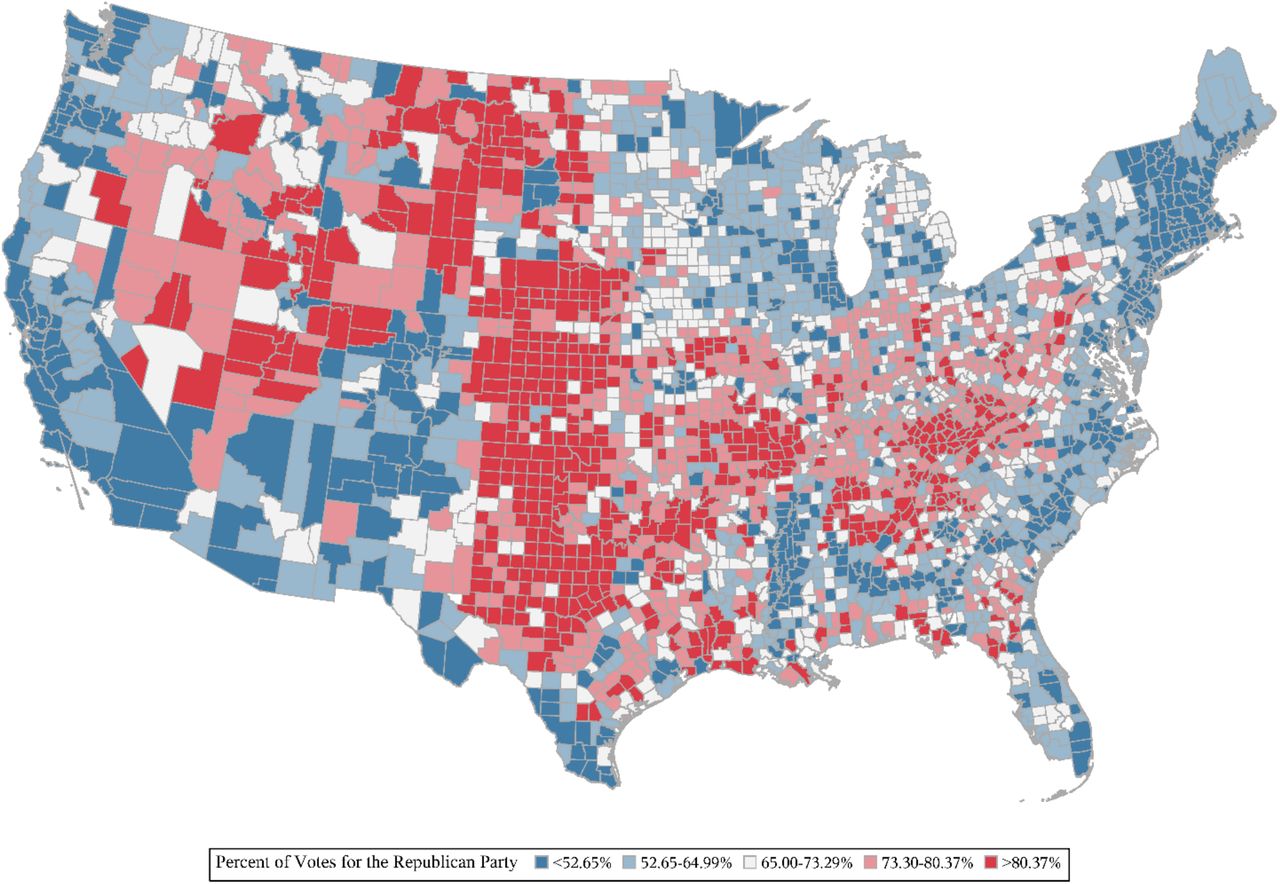
I’m sure all of us have been amused by the childish name calling and arguing of the recent presidential debates. However, this stubborn disagreement may affect you more than you think. In recent years, the political climate in America has been increasingly polarized with partisan politics favoring extremist politicians that must adhere strongly to the ideals of their respective parties. This was put on full display in the 2020 presidential election, with the presidential candidates taking stubborn stances on topics such as taxes, abortion, international affairs, and health care. This week’s map specifically studies the correlation between an area’s voting patterns in 2020 and that area’s increase in life expectancy since 1940. The most immediate observation that can be made about the two maps is that areas that tend to lean Republican also did not grow as much in life expectancy as Democratic-leaning areas. One possible explanation behind this is each party’s view on health care. To explain this, we must first explain the history behind America’s health care. America’s healthcare system has always been a topic of contention, but one thing that everyone can agree on is that it is dysfunctional. The country spends 17.8% of its GDP on healthcare, by far the most of any country in the world, yet it produces lackluster results compared to other first-world countries that spend much less on healthcare, in part due to the fully privatized health system of America (Sawyer, 2018).
Our health insurance was born when General Motors made a deal with the United Automobile Workers Union to provide health insurance to all their workers. This created a culture where health insurance is largely provided by your employer. However, not everyone can work. To combat this, President Johnson passed the Medicare and Medicaid Act as well as the Social Security Act to provide healthcare insurance for those who cannot afford private insurance, cannot work for employer insurance, are disabled, are too old, etc. Although this provided relief for the uninsured, many people remained uninsured, with 46.5 million Americans uninsured in 2010. This sparked the creation of the Affordable Care Act (ACA)/Obamacare which created several reforms such as expanding Medicaid, reforming private insurance, creating an employer mandate to provide insurance, and creating an individual requirement to buy health insurance. The ACA was massively successful in reducing uninsured people, with the uninsured population dropping to 26.7 million only two years after the ACA was implemented. However, republicans like Donald Trump fiercely fought this, eventually making Medicaid expansion optional on a state-by-state basis and striking down the individual mandate. As a result, republicans often opted out, and democrats often opted in. The single most life-saving factor of the ACA is the expansion of Medicaid, and it has been proven that Medicaid saves lives. In a study done in 2019, it was found that states that expanded Medicare saved 19,200 lives while states that opted out lost 15,600 savable lives (Broaddus, 2019). Circling back to the focus of the 2020 election, Donald Trump fiercely opposed the ACA, while Joe Biden firmly stood with it. Therefore, states that voted Democrat often enacted the ACA and reaped the benefits that came with it, while states that voted Republican repealed the ACA.
However, one state that seems to deviate from this pattern is Utah, the home of Mormons, with 70% of the state affiliating with religion. Because of this, Mormon ideals dominate the political stance of the state. Although Mormons vote Republican because of their views on abortion, gay marriage, and gender roles, they have very strict rules when it comes to lifestyle choices. For example, Mormons are forbidden to drink alcohol, consume any form of drugs, and smoke. They also promote healthy/natural eating, promote education, and prioritize a strong family life; all of which are correlated to living a longer life.
Now, how can we interpret this map as “critical cartographers?” This map was first published in Population Health, a scientific journal that analyzes social factors and their effects on public health. By choosing to use a map rather than a simple chart, the map makers further connect the data of life expectancy with the spatiality of the US states. Basically, saying that the problem of lower life expectancy exists within these specific areas. At first, one might assume that the role of these maps is to serve as purely scientific tools to visualize health concerns. However, there is a powerful political message that the maps send: if your state votes or aligns with republican ideals, then your longevity will be threatened. To further push this message, the maps used a spectrum from blue to red, with blue representing a higher life expectancy increase and leaning Democrat, and red representing a lower life expectancy increase and leaning Republican. This is also the traditional color scheme for each political party and not challenging that reduces confusion for the audience. As red is historically the provocative color, the map maker’s choice to assign these colors is a bias in itself, painting Republicans as threatening and inferior. Furthermore, the simplistic design of the two maps makes them seem more scientific and therefore more likely to be interpreted as fact. Even if the map makers didn’t intend for the political message behind the maps, the influence the maps have on its audience could be immense. With the 2024 presidential election getting closer, a rematch between Biden and Trump is likely. Powerful political tools such as these maps can be used to sway public opinion because of their seemingly objective message.
Works Cited
Lesley H. Curtis a b, et al. “Life Expectancy and Voting Patterns in the 2020 U.S. Presidential Election.” SSM – Population Health, Elsevier, 8 June 2021, www.sciencedirect.com/science/article/pii/S2352827321001154.
Matt Broaddus and Aviva Aron-Dine, et al. “Medicaid Expansion Has Saved at Least 19,000 Lives, New Research Finds.” Center on Budget and Policy Priorities, 6 Nov. 2019, www.cbpp.org/research/health/medicaid-expansion-has-saved-at-least-19000-lives-new-research-finds#:~:text=The%20Affordable%20Care%20Act’s%20(ACA,period%20from%202014%20to%202017.
Rachel Garfield, Kendal Orgera. “The Uninsured and the ACA: A Primer – Key Facts about Health Insurance and the Uninsured amidst Changes to the Affordable Care Act – How Many People Are Uninsured? – 7451-14.” KFF, 13 May 2020, www.kff.org/report-section/the-uninsured-and-the-aca-a-primer-key-facts-about-health-insurance-and-the-uninsured-amidst-changes-to-the-affordable-care-act-how-many-people-are-uninsured/.
Riess, Jana. “How Did Mormons Become so Republican?” Religion News Service, 14 Oct. 2020, religionnews.com/2020/10/07/how-did-mormons-become-so-republican/.
Sawyer, Bradley, and Bradley Sawyer. “Total Health Expenditures as Percent of GDP, 1970 – 2017.” Peterson-KFF Health System Tracker, 11 Dec. 2018, www.healthsystemtracker.org/chart/total-health-expenditures-as-percent-of-gdp-1970-2017-2/.
Schneider, Eric C. “Health care as an ongoing policy project.” New England Journal of Medicine, vol. 383, no. 5, 2020, pp. 405–408, https://doi.org/10.1056/nejmp2021701.
Blog Link: https://www.polgeonow.com/
Atlas Link: https://uselectionatlas.org/
This atlas shows the election results of each year for multiple positions such as president, president primary, senate, and governor. I chose this map primarily because it relates back to the map I chose. Also, this atlas is useful because it brings more attention to government positions other than president, as those elections are not given enough importance. Lastly, the data for these elections can be used to study the political climate throughout American history in order to study future political behavior.
This topic is extremely interesting, demonstrating how the polarization of politics results in shorter life expectancies in Republican areas. With Republicans pushing away from health care, resulting in shorter life expectancies what does this mean for the Republican Party as a typical Republican is older? Since 2020 the average age of a Republican has only increased. This makes me wonder if taking a stance against healthcare is detrimental to the Republican party and will result in many older Republicans passing away at a greater rate. The timing to me is also interesting as it is up with the start of COVID when many Republicans took a stance against the COVID-19 vaccination and were also anti-masking. Could the combination of refusing to provide Medicare and being against COVID-19 protection lead to the downfall of the Republican party?
I find this correlation to be super interesting and I thought that points of healthcare were great to bring up as correlation versus causation is important to consider here. Obviously, the political party that one affiliates with does not directly influence life expectancy as someone could hypothetically assume while looking at this map. It is what comes with these different political parties that could be impacting life expectancy, such as healthcare. It should also be considered, however, that because generally liberal areas are more populated, that this has something to do with it. Easier access to healthcare in cities, better paying jobs leading to affording healthcare advancements, etc.
This map truly shows the power of conveying information through spatial relations compared to other forms such as text or charts. While most Americans are aware of a health disparity within the United States. Most would be surprised when looking at this map. It does such a great job of showing the correlation between political affiliation and health outcomes. Showing that your vote really does matter. Often in politics, the importance of your vote can get muddled by the agendas of both parties. However, this map avoids all of that muddying and gets straight to the point. I do think when looking at his map it is very important to keep in mind its political agenda. Clearly, this map favors the Democratic party by showing that democratic areas have a higher life expectancy on average. But, as seen in the case of Utah, there are many other factors that can impact life expectancy. It might be that poorer areas tend to vote Republican, while wealthier areas vote Democrat, and there is a clear correlation between wealth and life expectancy. All of this is to say that political affiliation could be a good indicator of life expectancy, but not necessarily a cause.