
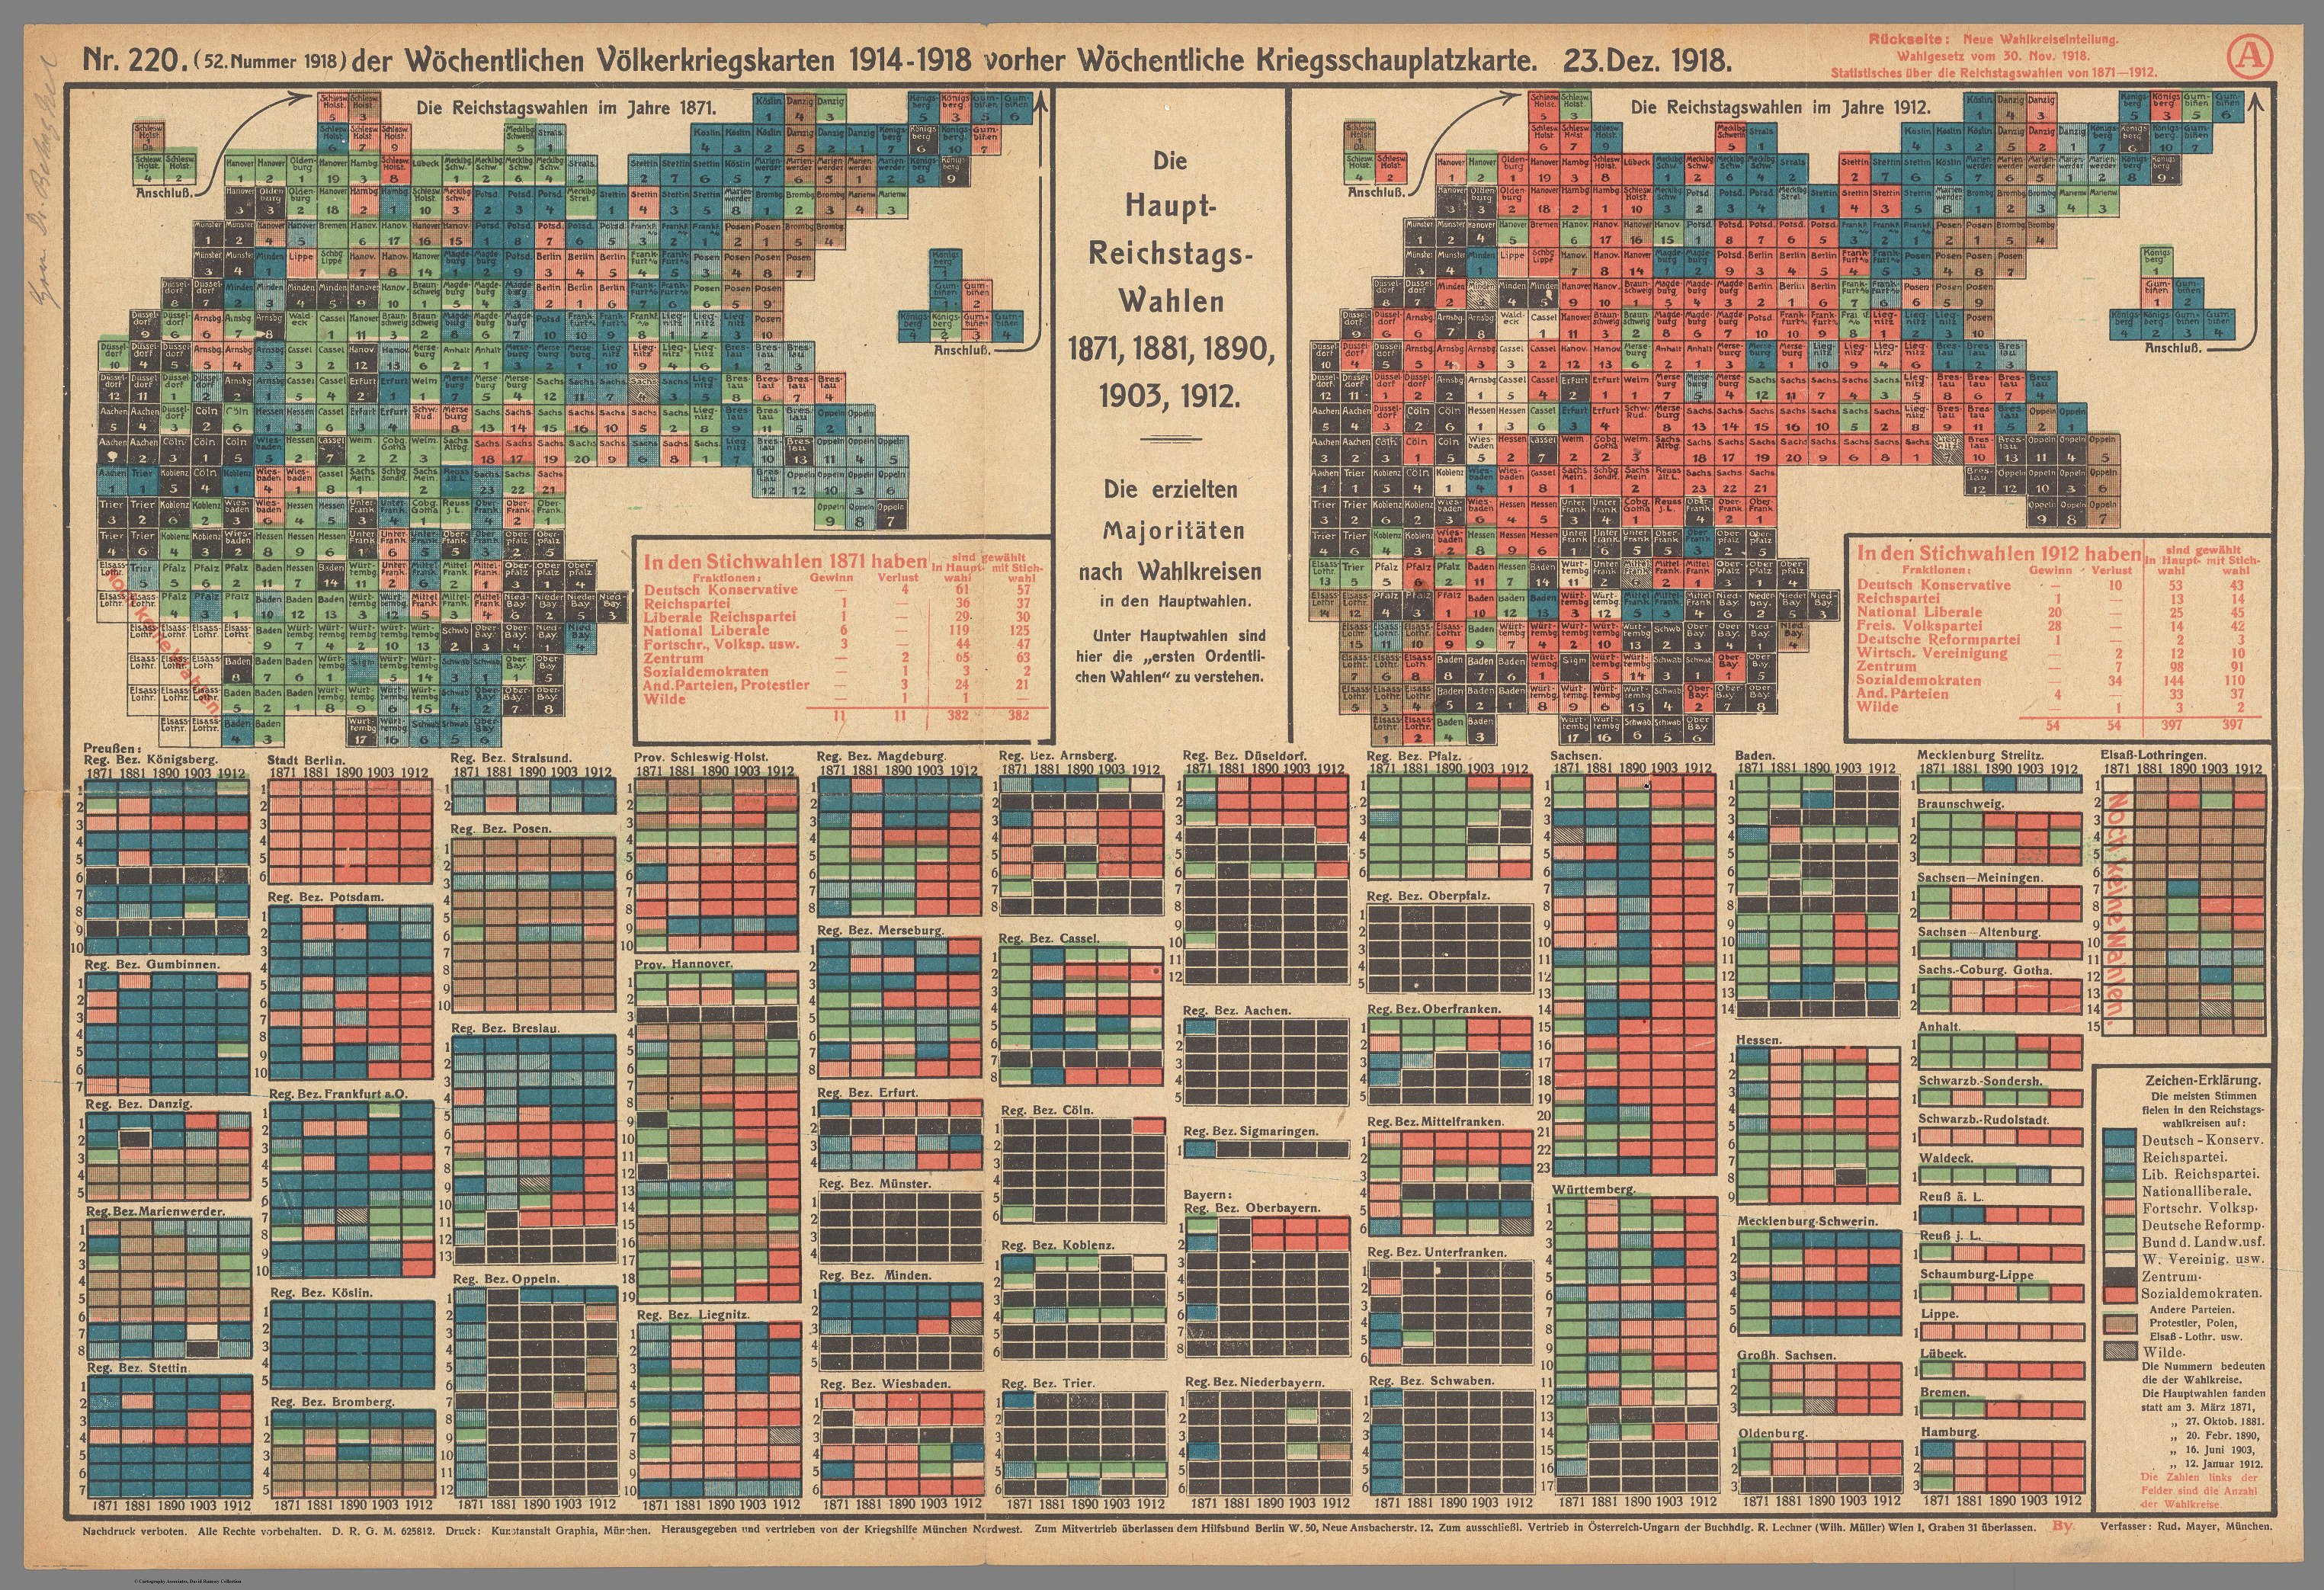
Forged in 1871 under the Iron Chancellor, Otto von Bismarck, the German Empire established a federal legislative body. The “Main Reichstag Elections” maps depict the votes of those German constituencies and the number of deputies. It was published in 1918 by Rudolf Mayer in a Munich newspaper. It was distributed as the 52nd issue (1918) of the weekly war maps 1914-1918 by the Munich War Aid program.
After doing a double-take to make sure this is not a periodic table of elements, the viewer can see the rigid boxes form the shape of the German Empire. Distant border regions such as Ostpreußen (East Prussia) and Schleswig-Holstein have been cut off from the Vaterland. They are shown as Hawaii and Alaska would be shown on a map of the US, however, they are still contiguous parts of Germany. This is most likely due to the distorted map of Germany being placed on a square piece of paper. The overwhelming amount of color and data almost drowns out some of the finer details. The newly annexed western region of Elsass-Lothringen (Alsace Lorraine) is stamped with the text Noch Keine Wählen, indicating this Imperial Territory had not yet had any elections after being seized in the Franco-Prussian war. Aside from this brief historical context, a plethora of German political parties are represented. Although the Kaiser ruled the Empire, the Bundesrat (Federal Council) acted as an elected legislative body. We can see the clear support for the Social Democrats, red, and the National Liberal party, green.
I find the lack of political borders between the German states, which still held power and had kings, such as Bavaria, to be a major silence. Additionally, the population of the Empire is not shown. This makes it difficult to understand how much of the popular vote each party received. The success of regional parties helps compensate for the lack of demographics shown as we can still see where parties such as the Polish Party have influence. This representation of the constituencies still represents what we could consider a map. The relationship between the distant parts of the country show unity in the Bundesrat. The largest parties are not confined to a single region, but instead stretch across the country. This presented unity tries to persuade the reader that Germany is one, as a whole, not a conglomerate of states and kingdoms.
Although present, the message of this insignificant author, Rudolf Mayer, is not noticeable. Mayer wrote a statement simply stating the main elections are here to be understood. This does not tell the reader much, however, considering the war aid program distributed this, it was probably trying to build support for the government in 1918. Germany was being embarrassed by defeat, hit by the Spanish flu, and fighting unrest and needed any public support it could get. The audience of the map was the general population but considering how discontent they were, especially with events such as the Spartacist uprising (BBC), I doubt the map changed anyone’s opinions. The collage of colors in little squares fails to make any impactful statement for the reader.
The chart and map do not tell us much about the social upheaval and strife happening in Germany because it only shows us maps from 1871 and 1912. We also do not get to learn much about the German people that the map represents. The legend and maps neglect to tell us about why the German political climate and parties shifted in so many regions between 1871 and 1912. This map covers up all of the chaos in Germany and imposes a weak statement over it. We have been left to only make assumptions about data in which the reader could discern any message. I believe this means the author failed to convey a sense of unity to the people.
Works Cited
The End of World War One, 1918-1919 – Weimar Germany, 1918-1924 – Aqa GCSE History Revision – Aqa – BBC BITESIZE. www.bbc.co.uk/bitesize/guides/z8vt9qt/revision/1.
When I first scrolled down the blog posts and saw this map I was so confused I had no idea what this map was showing. I thought it was funny that he made a joke about it looking like the periodic table because that’s exactly what I thought it was. I think Brian did a really good job of breaking down the map and explaining what it was especially given how complex and elaborate of a map this is. He did a good brief intro to the map and then gave facts along with some opinions to really give the reader solid information about this map.
It’s pretty funny that we both ended up doing maps of World War I Germany for our map posts, but they really are completely different in what they cover despite having pretty much the same base. I completely agree with your conclusion on the map, because really, whose opinions would’ve been changed by this utter mess? The best maps can be understood just by glancing at them, and this one very much does not pass that test even if it looks cool with periodic-table-esque structure. It’s certainly interesting though as a predecessor to all of the election maps that are now commonly seen on the news pretty much every election season, but of course the square structure was abandoned for the standard state representations we have now. Super cool map overall though even if it isn’t great at conveying its information, and fantastic analysis of course.