
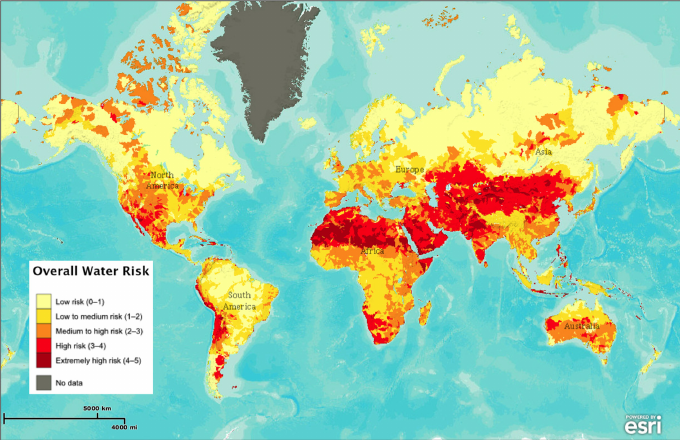
When thinking about water risk around the world, you immediately think about Africa, Asia, South America, and other developing regions of the world, not the United States. Surprisingly, many different regions in the United States have water supplies views as high risk. For the map of the week, I have chosen the Overall Water Risk map. The overall water risk map identifies areas with higher exposure to water-related risks and is an aggregated measure of all selected indicators from the physical quantity, physical quality, and regulatory and repetitional risk categories.This map is an interactive one found on the Water Resources Institute’s website, wri.org. The interactive version allows viewers to break down specific water risks such as the physical quality or access to water. The interactive map also allows users to enter coordinates to have a much more detailed insight into the water risks in a specific area.
As one might be able to predict, some of the highest risk areas include northern Africa, the Middle East, and Asia. These regions are typically what comes to mind when discussing areas that have water struggles. However, areas in the United States, such as the southwest and midwest, are considered “high risk” areas. This came as a surprise to me when I first discovered the map. However, after conducting further research, it makes sense given the formula that is used by the mapmakers. The areas in the southwest score poorly in physical quantity due to frequent and severe droughts that residents of the area experience. Furthermore, much of the midwestern United States has been labeled as “extremely high risk” for physical quality. This is due to examples such as Flint, Michigan that have suffered from contaminated, unhealthy water sources. Fortunately, the United States is in an area of “low risk” for regulatory and reputational risk.
One aspect of this map that I found particularly interesting was that far northern countries such as Canada, Russia, Sweden, Finland, Denmark, and Norway all have remarkably low water risks, much lower than a majority of the rest of the world. Part of the reason that these countries enjoy such low risks are due to the fact that they are well developed and wealthy countries that are able to have clean, well managed water systems. However, the United States is also a wealthy, well developed country with clean water but have somewhat large areas that are labeled as “high risk”. This leads me to believe that part of the success must also be as a result of the northern climate that these countries are in; as mentioned earlier, part of the reason why the southwestern United States is deemed high risk is due to the extreme droughts that the residents are suffering through.
The projection of the map, as is the case with an overwhelming majority of maps, reveals biases held by the mapmaker. Africa appears much larger than what is seen from most maps that one would encounter in the United States. The author may have done this because Africa is a nation that faces many water issues and the larger projection of it allows for better detail to be added, as well as make the regions affected appear very large. This can cause a viewer of the map to view the issue of water risk much more seriously based on the size of these affected areas in Africa.
This map could be very useful to many world travelers as they can develop a solid idea of the water situation in potential areas of interest if they are unsure of the current conditions. I genuinely enjoyed finding and exploring this map. Prior to viewing I would not have thought that the United States could be an area of high risk water but this map has changed my thoughts and hopefully does the same for others as well.
Wow… This is an incredibly eye-opening map, especially in detailing water risk in the United States. Like you, I was also surprised to see the severity of water risk in the United States. And, after reading your blog and exploring your map, I would guess few people would be able to give an accurate estimate of the severity of water risk in the United States. Further, I think you’re right when you say the reason northern nations don’t struggle nearly as much as southern nations is because of the climate. To add, I think the fact that Canada and a lot of the nordic nations you mentioned don’t have as dense of a population as the United States and southern nations increases water availability. I’m interested in what scientists predict the same map would look like in 30 years. Great job, Evan.
I think this map is a fascinating look into the health of water, something that is often taken for granted in wealthy countries. Before looking at this map, I generally felt that I could out my full faith in the US Government to ensure there is clean water. Yet as you explained, water cleanliness can often be associated with geography rather than simply the economy of the country. What I find the most compelling about this map is its ability to change the viewers preconceived notions about the world. Rather than reinforcing a common place expectation about water, this map turns convention on its head and presents the world in a unique way. Lastly, your critique of the maps projection is especially important since it in some ways reinforces notions about Africa having poor water. By making Africa bigger, the cartographer emphasizes the risk of water in that area as opposed to in America. Overall, I think this is a fascinating map which tells a lot of different stories.
I enjoyed reading your analysis of this map. I found your discussion of how the success or wealth of a nation, along with location and climate, all contribute to a region’s overall water risk. In addition, the fact that southwestern United States was at risk was very surprising to me as well. This map is fascinating to just look at as well, because it reveals a lot about how location plays such a major role in the success of a nation, since typically, nations closer to a source of water has a leg up in becoming a thriving and prospering country.