
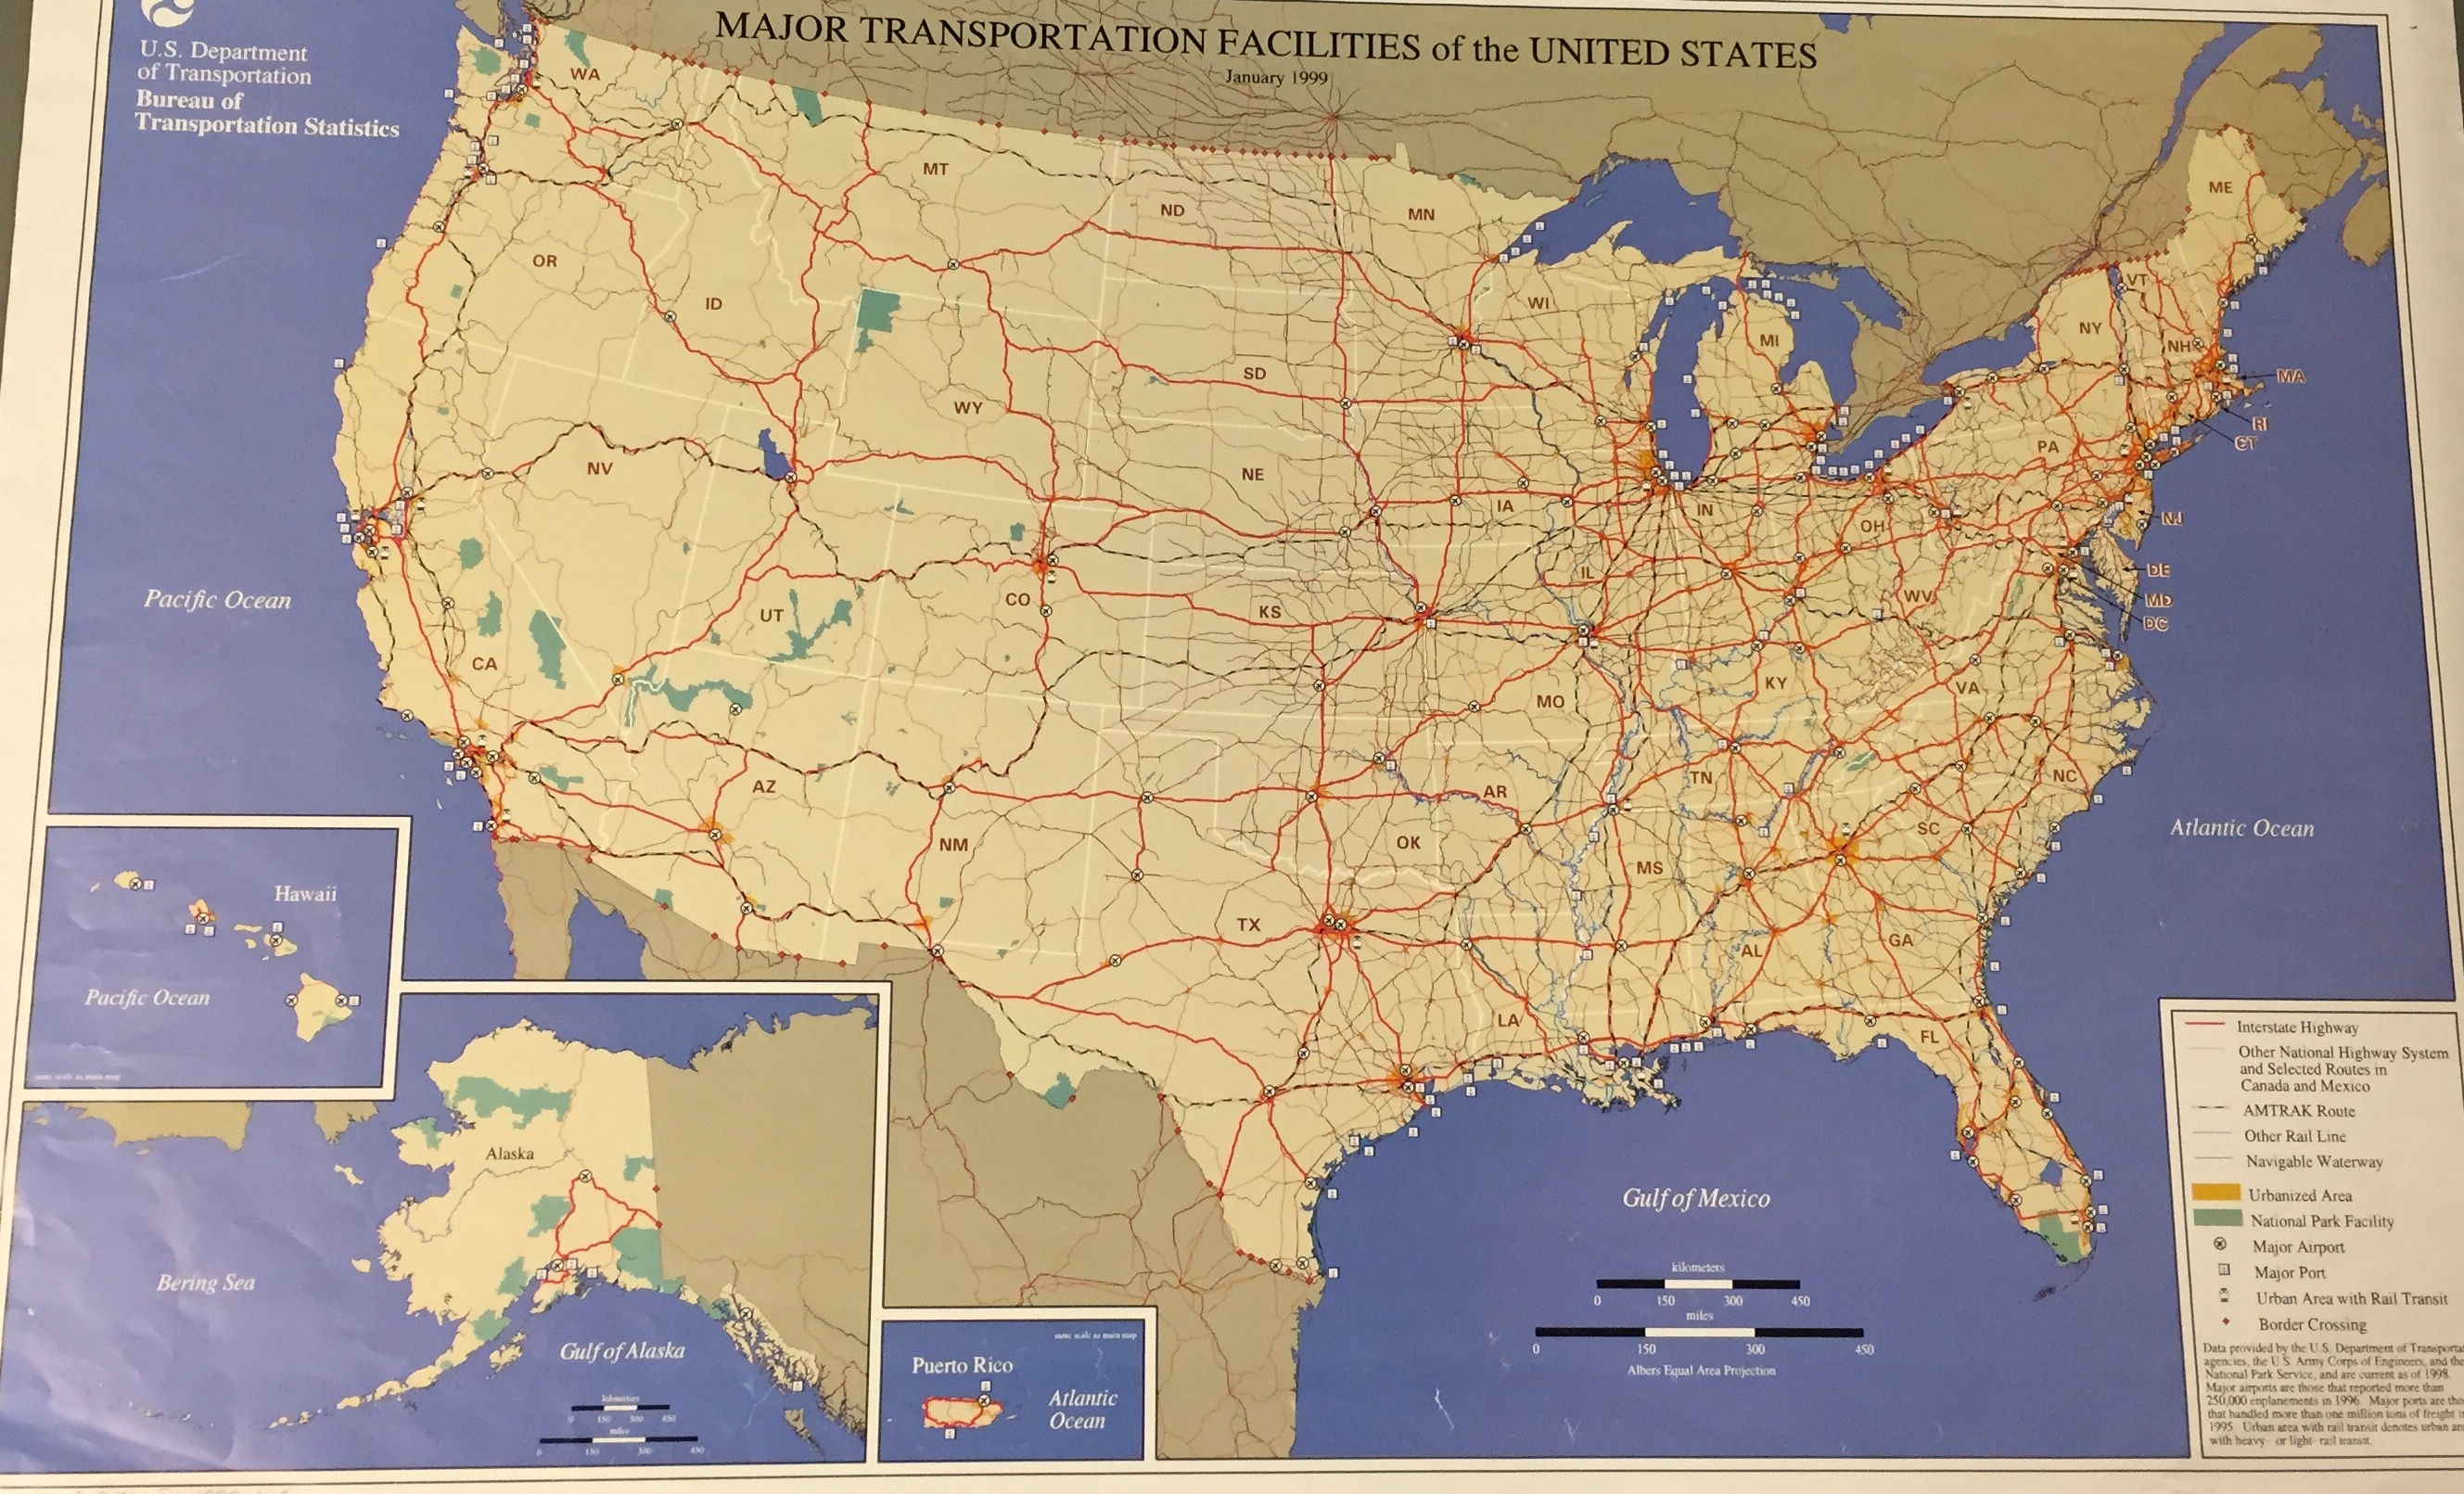
We all know that transportation is a vital part of our everyday lives in the US, but do we really know the specifics of how it all works? The map that I have selected depicts the major transportation facilities of the United States in 1999. The map was produced by the Department of Transportation which is a department that tries to improve the transportations systems in the United States. When this map was created, the United States had a highly developed transportation system equipped with many options for getting in and around the country. From cars and buses to trains and planes, all various forms of transportation were available to most American people. However, this map does not just depict what types of transportation people use, rather what areas in the United States see the most travel of goods and people. As shown on the map, more urbanized areas and cities have the most highways, railways and waterways running through them. In addition some things that are labeled on the map are major ports. The majority of these ports are found along the east coast. This could be due to the fact that goods are being transported across the Atlantic Ocean from European countries.
I chose this particular map because transportation of goods, services and people often get taken for granted. When you pick up an avocado in the grocery store, you hardly think of how that avocado got from the farm, to the grocery store and into your hand. This map makes us think more about transportation and how urban areas are the hub of it all. The transportation of goods and people contribute to the transportation of ideas across the US. This movement of ideas causes cities and ports to be more progressive in their thinking, which is shown in the map. In addition this map shows how connected major cities are across the country and this connection allows for the United States to be a nation based on industry and technology. The US has been built on the idea of infrastructure and industry. The elements of industry and technology contribute the pprogressiveness of the US. This projection allows the audience to focus in on specific transportation across the US and see the difference in transportation between rural and urban areas. Rural areas are more spread out and less people populate them as opposed to urban areas such as cities that are full of infrastructure and has a high population.
While looking and analyzing this map, I can find some critiques for it. For example, I know that the map was developed by the US Department of Transportation, which is a federal administration with offices around the US. However, I would like to consider what group of people specifically made the map and if their views influenced the map. Was the map developed in an urban area? If so does the urban area inflict bias towards the layout and the projection of the map? A common concept about maps that goes unnoticed is that maps show silences. These silences are the deeper meaning of the map and the important details that relate to the map but are not shown on the projection. The silences on this map that I think about are economics and the flow of money when goods and people are transported. For example, since urban areas and cities have the most transportation flowing through it, cities are taking in the most money. And therefore, the more Midwestern states and rural areas are bringing in less money due to the lack of transportation and goods going through the areas.
Another concept that is used to describe cartography is that maps are often very political. I would describe this map as an ethnocentric and political map because it only shows the transportation of the United States. The idea of transportation is political because it exposes the different relationships between people in the US who can afford more efficient transportation as opposed to people who cannot . This map also shows political aspects because it favors the US and puts our transportation system above others. Since the map was created by a US federal department, it is known that ethnocentric bias towards the US is going to be embedded in the map. This bias can be derived from the people at the Department of Transportation who want to show off how industrialized our country’s system of transportation system is.
The Major Transportation Facilities of the US is a very insightful map that shows the interconnection of cities and transportation across the country.
Ellie,
My atlas of the week dealt with similar subject matter in that it outlined all of the transportation routes in the world, so I am particularly interested in your choice! I like your idea about the importance of infrastructure and industry in US history and how transportation changed over the years , helping the US grow into the country that it is today. I think that your critique about who this map was made for/ the bias it may have is very important as the audience and silences of a map often go unnoticed but can change the way we view a map. Your post was thorough and exciting and I appreciated it!
At first glance, this map is overwhelming. I felt like I was staring at a mess of intricate, yet confusing red lines that extend across the whole country. However, when observing the map more closely it becomes less confusing. It is definitely clear that major cities are main hubs for transportation, with many red lines condensed on the big cities. It was interesting to read your take on the political part of this map because when first looking at the map I wasn’t thinking about the politics behind it. However, after reading your critique I agree the map is ethnocentric to the United States and is looking to highlight the development and industrialization of the country. The map portrays the United States as a highly developed and interconnecting country that has a set system of transportation for all parts of the country which definitely is boosting the pride of Americans looking at the map.
Hey Ellie,
I really liked this blog post and it made me think more about the ways in which transportation works. Your opening questions really made me think and made me more intrigued in what you had to say. At first glance the map did seem confusing and unorganized but it eventually made sense. With all of the criss-crossing routes it really shows how interconnected everyone is throughout the United States. Like you said, not many people think about how certain things end up in certain places, but after reading your post and viewing this map it made me realize all of the complications behind the transportation system and the aspects of creating such a system. I think you did a really good job explaining all of the different aspects of this map and critiqued it in a very helpful way!