
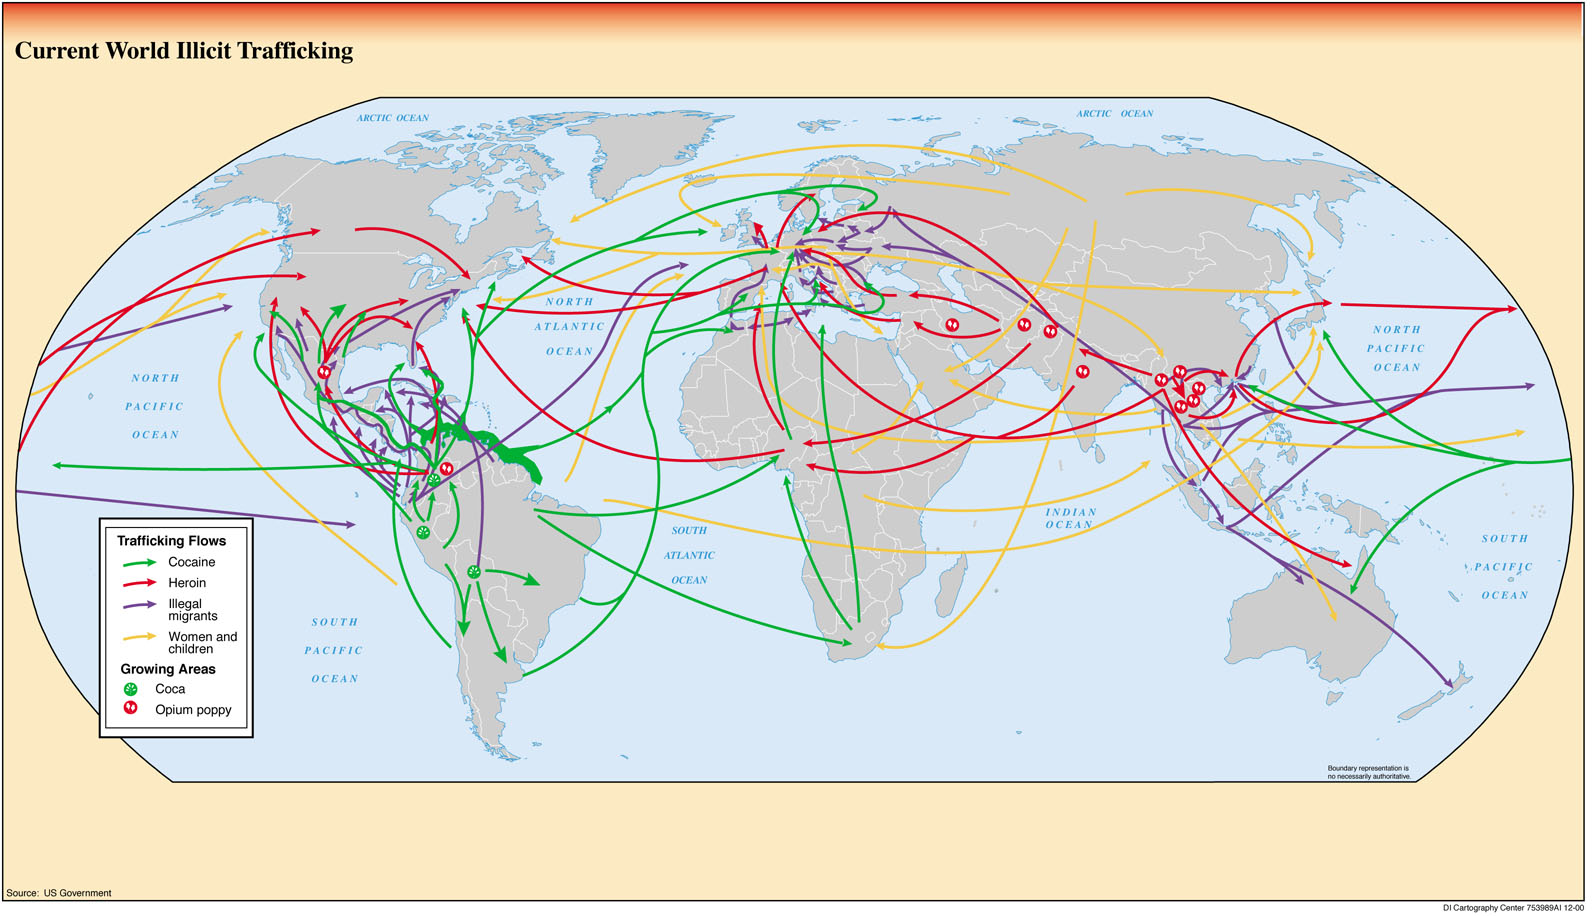
 Regardless of the morbid content it holds, the chosen map is fascinating for charting black market activity worldwide. While there is a distinctive lack of common cartographic labels for countries, the map remains intricate through projecting trade routes of four illegal commodities and growing areas for two supply plants. The data itself is aged, being released in 2000 as a component of a National Intelligence Council release. A collaborative effort of the NIC, CIA, and non-government scientists from universities or research institutions researched the original product. Their report is designed as a projection for the state of the world in 2015, encompassing the rapidly expanding population of megacities in addition to predicting availability of water. The Illicit Trafficking map is created to illuminate the international state of black market trade while simultaneously inundating the reader with the scale of the problem.
The map’s data strongly favors the visual and symbolic rather than textual. Four different colors represent cocaine, heroin, illegal migrants, and women & children, with several hubs around the world for a mixed variety of these products. Using both intuition and a labeled world map, Columbia is a nexus for cocaine production. In creating the map, the researchers used an overwhelming network of arrows to emphasize the strength of the drug trade extending across the borders of the world. Additionally instead of arrows, there are cores of growth scattered throughout the continents. Coca is plentiful in the Columbian region, bringing logic to the mass of green arrows that form a spider web across Central American and the Atlantic Ocean to both Asia and Europe. The northeast border of South America appears to have a very enthusiastic cocaine trade, for it is the only region solidly colored in on the map. However, following the same path as cocaine into the United States is the influx of illegal migrants from South America. When juxtaposing these two routes the immigrants seem rather docile next to the network of illegal drug trade, highlighting one of the map’s flawed representations. To consider illegal migrants as having the same paths and mindset as drug traders is detrimental to their population. In addition to the flow out of South America, the southeast region of Asia is brimming with opium poppy plant farms, giving some validity the area’s nickname as the “Golden Triangle” of heroin. The trade of heroin can be traced across Asia and the Pacific Ocean. However the Triangle is not limited to simply the export of heroin, as the routes of women and children spread up to Japan and cross the Indian Ocean. Again comparing to a traditional world map, another major port of black market trade can be found in Nigeria, where there is a plentiful flow of cocaine and heroin from South America and Asia, and an appropriately energetic export to the United States’ east coast and central Europe.
These frequent comparisons to a standard world map highlight a major flaw in the structure of the NIC map. The mass of detailed arrows is an excellent consolidation of massive collections of data, yet their effectiveness diminishes without country data to accompany it. Therefore without consulting outside sources, the map is useful at only observing broad regional trends. For example, Germany appears on the map unnamed, but a repository for all four trade factors examined. As a result when referring to trade only generalizations such as “central Europe” can be used to quantify the trade routes. Leaving the country names off the map was a deliberate choice by the group of cartographers in construction, intending to avoid rendering the map excessively cluttered. Even in its current state it is difficult to read at times, in particular at the most active trade sites in Central America and Eastern Europe. Their choice is enigmatic, adding a layer of confusion for the sake of reducing potential confusion. For Central America in particular, the diverging mass of arrows used highlights the cartographer’s intentions to emphasize factors that the map’s supporting U.S. government institutions believe to be the most critical. In the end their decisions are justified, leaving the map legible and coherent after labeling only the oceans. While leaving the oceans labeled is likely a result of having more working space, it is also a reflection of desires to express the international scale of this trade and the effect it has on each continent.
In creating this map, the NIO, CIA, and the assisting institutions had precise intentions of what were necessary targets to highlight. As a result highly addictive drug production and distribution was illustrated alongside human trafficking and illegal migration. While the three primary trades are vastly different from each other, this illuminates the logic behind their choices. For example, if all trade routes were of drugs the map would have little depth, being pigeonholed into a preexisting mass of War on Drugs propaganda. Instead the audience is presented with a rich map enumerating the government’s foci of primary interest for the future. The NIO’s map is carefully detailed and intricate, emphasizing that the span of the black market is global, crossing borders and touching nearly every major country.
Works Cited
US Government. “Current World Illicit Trafficking.” University of Texas Libraries. N.p., n.d. Web. 19 Sept. 2014.
Historical Atlas of the Holocaust. N.p.: Macmillan, 1996. 252. Web. 3 Oct. 2014. <http://we4mf3mv5e.search.serialssolutions.com/docview/38906638?accountid=14731>.
The atlas encompasses the entire span of the Holocaust, starting from the earliest actions of Nazi Germany into their final days. Some unique maps included are different from the traditional Allied perspective, and instead include some Axis maps. One in particular details the size of the Jewish population remaining in every European country.
Esposito, Vincent J. The West Point Atlas of American Wars. New York: Praeger, 1959. Print.
This is one of the older texts that was readily available in the maps section of the library. True to its military background, it gave extraordinarily detailed accounts of United States warfare. The information encompasses even the civil war, where troop movements were charted.