
source: http://www.census.gov/history/www/reference/maps/1790_population_map.html
How could a map exclusively of the United States shape national identity and American international relations? The Department of the Interior’s map of the population of the United States shows the population density of 1790. This was the first time Americans were able to pinpoint exactly where they were on the map while also showcasing the uncivilized western territory. Maps like these provide a sense of identity as an American citizen. However, this map does exclude certain groups, such as the Native Americans. The map, along with its necessary silences, is an early example of the young nation showcasing its potential power. The Population of the United States map proves that a map of one nation can have an impact on the way America potentially behaves internationally.
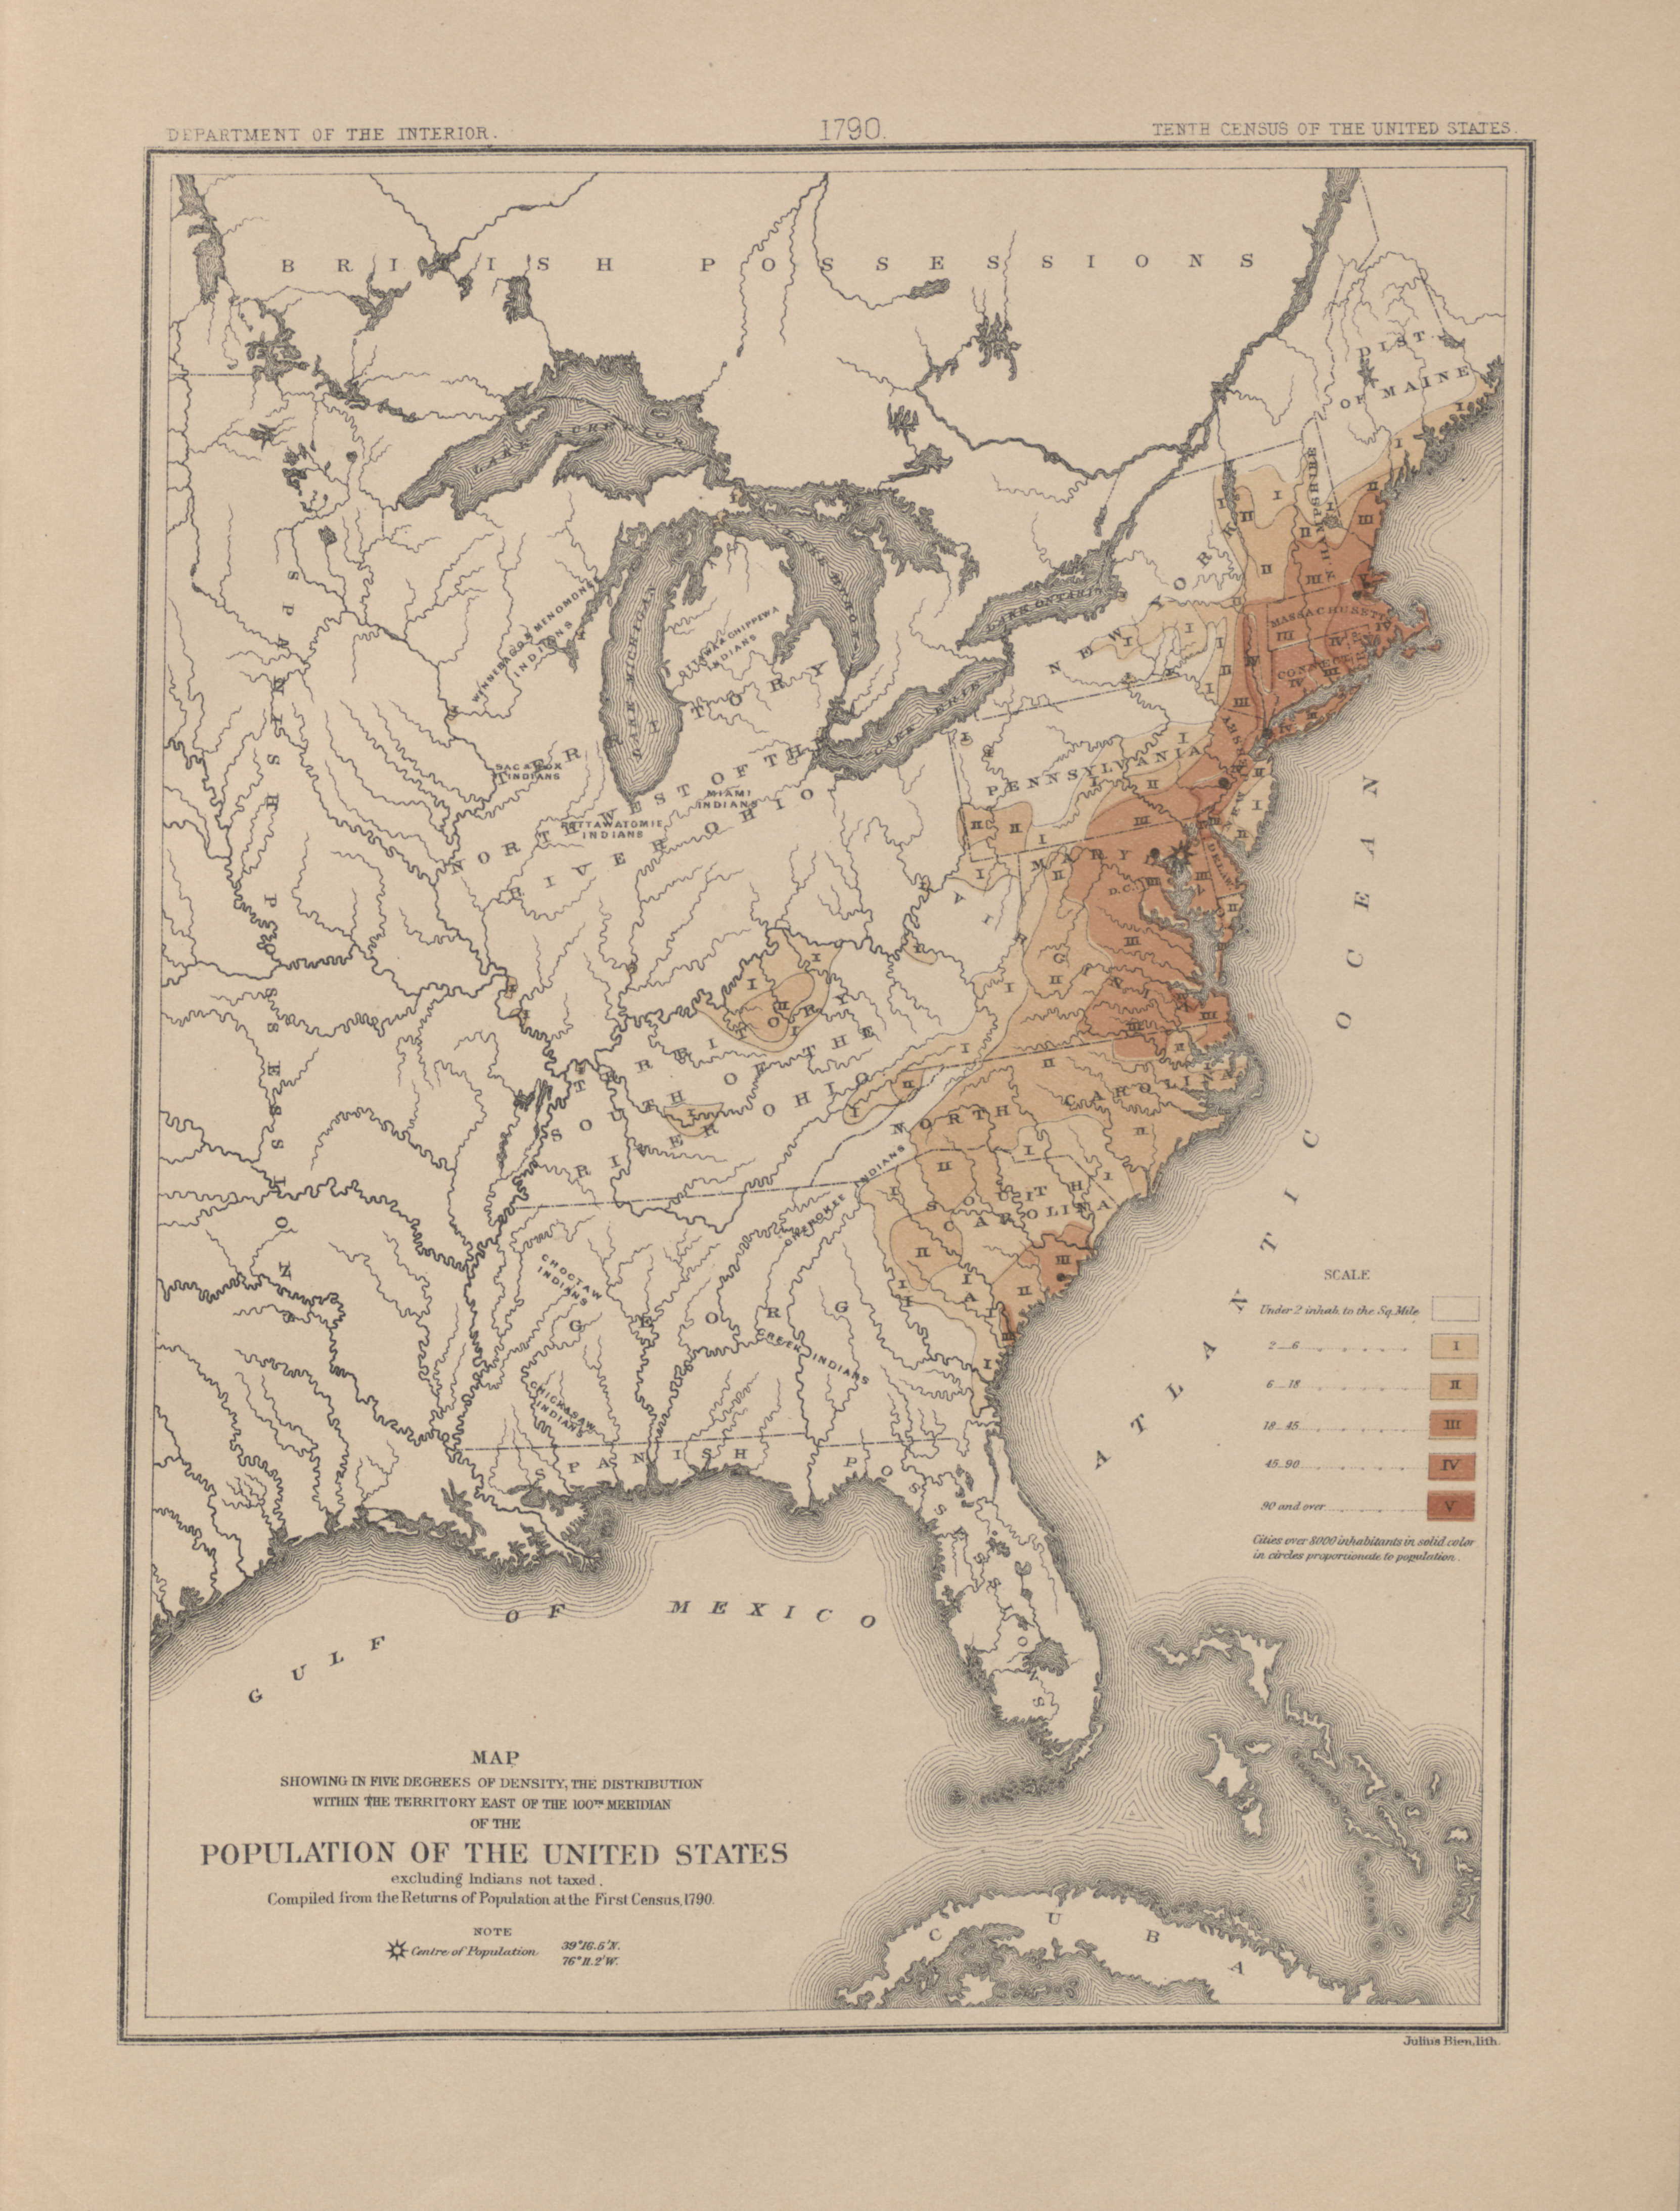
The first census of the United States was collected in 1790. The Department of the Interior put together maps that showed population density with this information. The densest areas (mostly coastal areas) are indicated by a dark shade of brown and the color lightens as it travels west and the population becomes less dense. Not only does the map show densely populated areas, it unveils the never ending wilderness to the left. All this territory belonged to the United States and an American citizen looking at this map could see the endless possibilities of the frontier. One of the main responsibilities of the Department of the Interior was the “exploration of western wilderness” (“History of the Interior”). A map such as this, created a desire to explore and tame the rugged land and to conquer every corner of the country. In early American history, the continent was their identity (Schulten). As the country began to grow accumulate more land and people, it established a uniquely American identity and drive that would later carry through the country’s international relations. This map motivated Americans to claim the West and spread their presence throughout the world.
A map cannot possibly include everything one may want it to. What the author chooses to leave out is called a silence. According to J.B. Harley, “maps-just as much as examples of literature or the spoken word- exert a social influence through their omissions as much as by their features they depict and emphasize”(Harley). The map blatantly states that it excludes non-taxed Indians. This map created an American voice while silencing the voice of the Native Americans (Bruckner). The U.S. Census counted white males over the age of 16, white males under the age of 16, white females, and slaves (“1790 Population Map”). Notice, the map does not have a different color for a particular group of people; it maps the total population. The reader cannot differentiate the number of slaves in a particular area because of this particular choice. At a time when only white, adult males were able to vote, this map does not exclusively show them. Women, children, and slaves were accounted for and have a place on this map. Where someone lives is just as much a part of their identity as their name, especially in early America (Schulten). Seeing oneself on this map made one feel like an important part of the nation which increased a sense of pride among Americans.
This map created a sense of American pride among the inhabitants and it shows the potential power of America. Nations started using maps as tools of power since the age of exploration. The British Empire and much of Europe used maps to show superiority and more refined culture than their colonies and the rest of the word by distorting and “painted bombastic scenes of territorial conquest” (Schulten). American cartography was much less elaborate. Most early American maps were inexpensive and practical. The population density map does not show American power the way a British map does. The size of the country alone is intimidating and presents America with a challenge. If America could conquer the great unknown of frontier, then it could conquer the rest of the world.
This map of population density did not only show population. It is a statement of America. First, it created a drive to discover and harness the West. Second, it created the voice of the country, but also silenced the voices of the Native Americans. And ultimately, it showed the potential power of America. Once America civilized the West, there was no limit as to how far it could stretch its reach across the globe.
Shayna Webb
Works Cited
Brückner, Martin. The Geographic Revolution in Early America: Maps, Literacy, and National Identity. Chapel Hill: Published for the Omohundro Institute of Early American History and Culture by University of North Carolina, 2006. Print.
Harley, J. B. Maps, Knowledge and Power. N.p.: n.p., 2004. Print.
“History of Interior.” U.S. Department of the Interior. N.p., n.d. Web. 04 Oct. 2013.
Schulten, Susan. Mapping the Nation: History and Cartography in Nineteenth-century America. Chicago: University of Chicago, 2012. Print.