Category Archives: Uncategorized

GIS Analysis for Land Conservation Decision Making

Post by Marissa Parker ’16

Last week in the SAL, we took on our first full project as SAL interns, working for the Chesapeake Conservancy and the Capital Region Land Conservancy (CRLC). The Capitol Region Land Conservancy is a local non-profit land trust that aims to “conserve and protect the natural and historic land and water resources of Virginia’s Capital Region for the benefit of current and future generations” by facilitating the creation of land easements. These land easements permanently limit development to maintain the health of watersheds.

Counties Map For Blog2

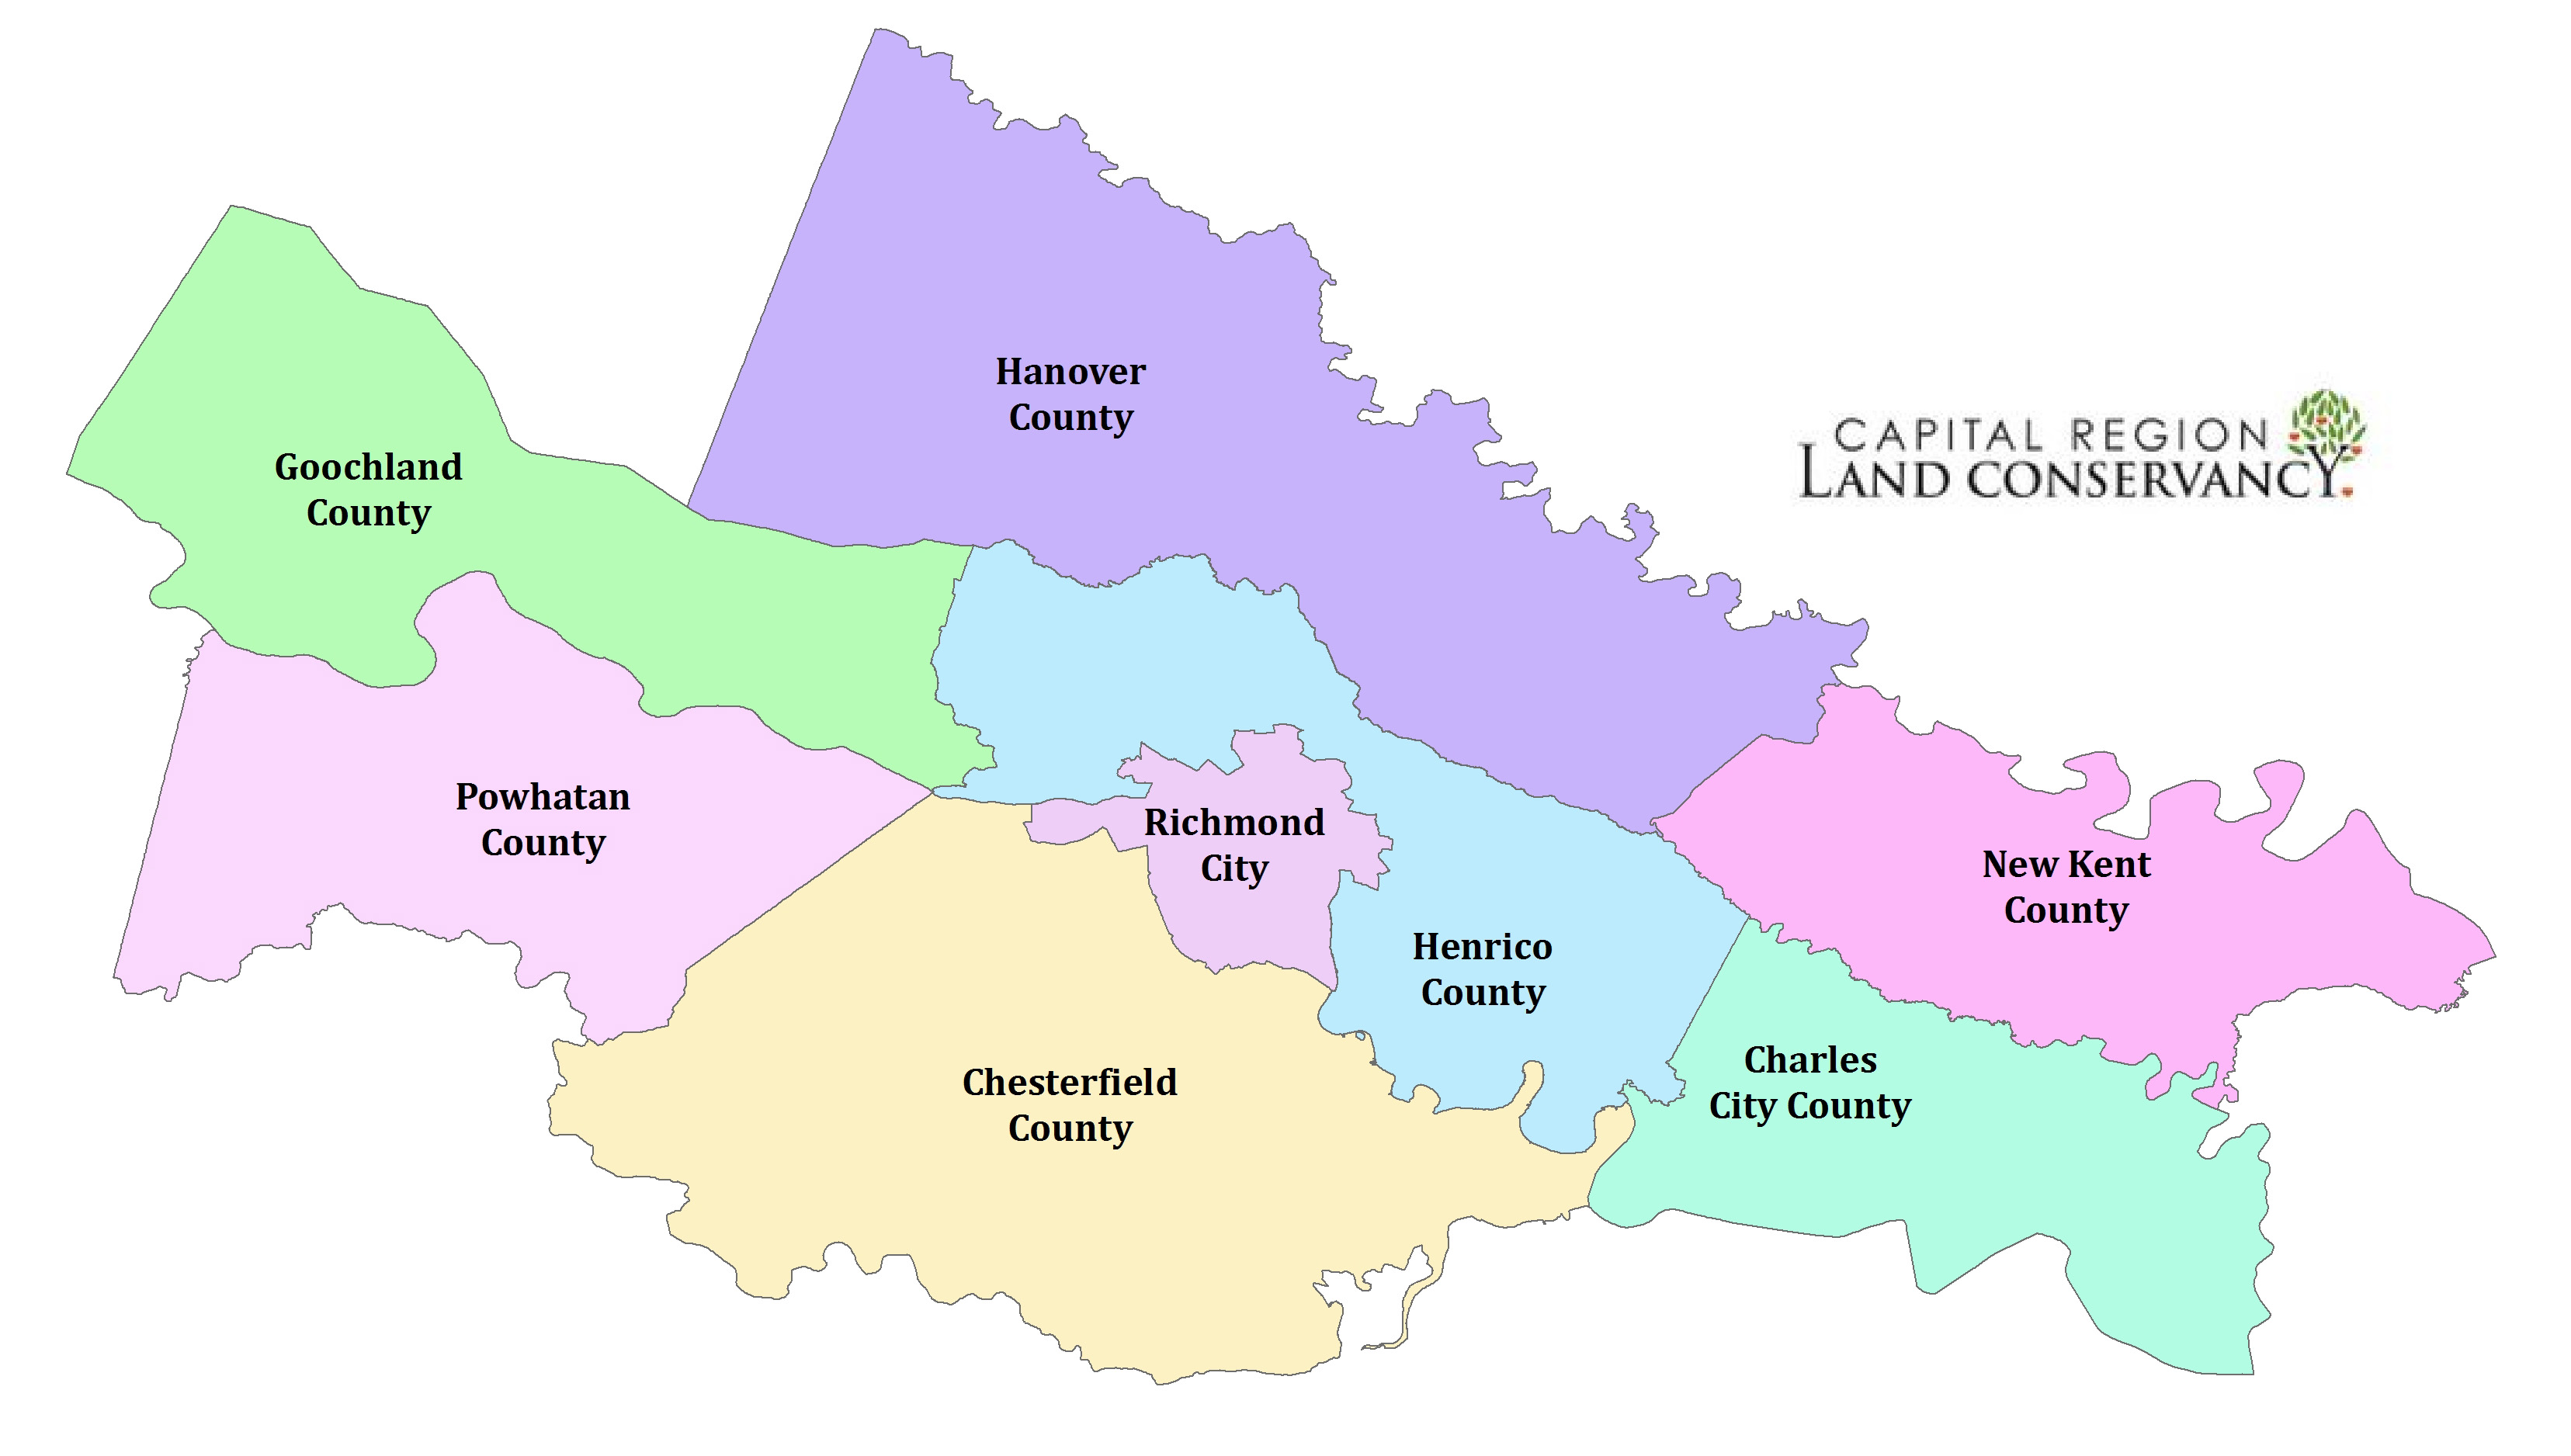
These 7 counties and City of Richmond comprise the “Capital Region” the CRLC focuses on

To assist in their efforts to protect our community’s ecological health, we provided GIS services to the CRLC working in collaboration with the Chesapeake Conservancy. Our project for these clients was to create a database to evaluate various attributes of land parcels within eight counties (see map above) surrounding Richmond to help the CRLC make informed conservation decisions. Some attributes that we evaluated include location of each parcel within a floodplain, amount of natural land cover and wetland habitat, and the inclusion of historic places. Using ArcGIS software, we completed these analyses to create a single geodatabase containing extensive information on each land parcel in the eight counties.

We also completed a Viewshed analysis on local scenic byways—roads that run along the James River—which displayed areas that are and are not visible from the scenic byway, up to 5 miles away. This provided information on visibility of land parcels from scenic byways, which also will inform CRLC decisions. The picture below shows how some areas are visible from the byways while others are not, due to elevation and canopy cover.

Viewshed_Sample

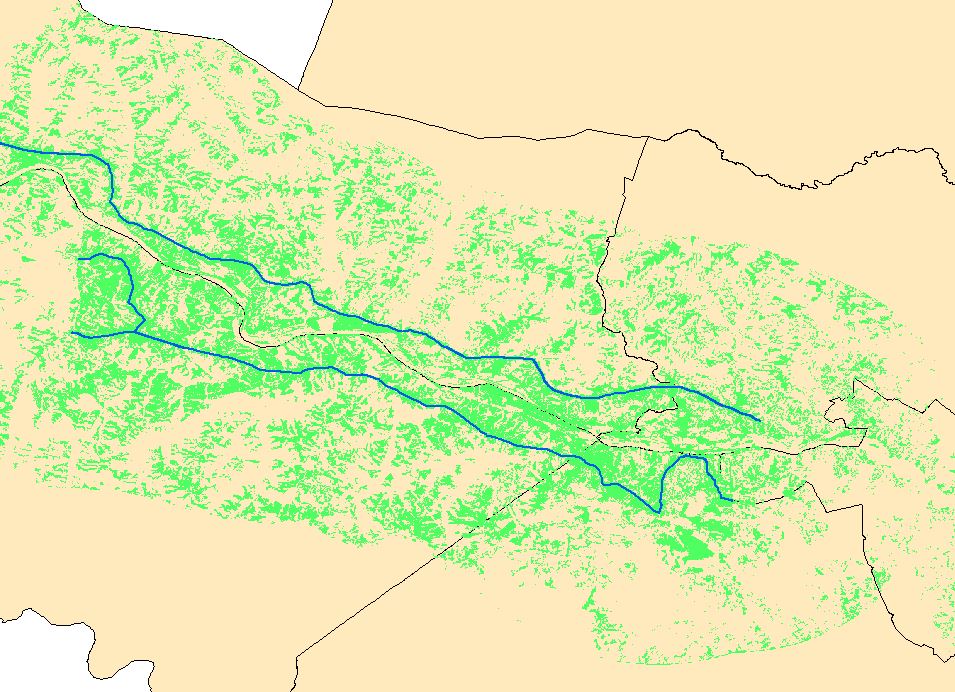
The blue lines are scenic byways with views of the James River. The green areas are pixels identified as “visible” from the scenic byways. We included if a land parcel contained visible pixels in the data we sent the CRLC.

This project will help the CRLC in their creation of new conservation easements and provided us interns with first experience working as a team to complete a large project using GIS.


Welcome to Summer 2015 in the SAL

Hi All!

We are very excited to say it is going to be a very busy time in the SAL this summer! We always have a variety of interesting and innovative student research projects underway in our little corner of the International Center, but this year we’re packed to the brim! In addition to research projects being conduced by Natalie Somerville,Heather Courtenay and Kerry McGowan, we have four students taking part in our S4 Summer Intern program. These geographers will be building their skills through a variety of long term and short term projects designed to help our “clients” and partners over the summer. Stay tuned to the SAL blog as we bring you exciting updates on their work and progress!

Some of the things to look forward to:
-Database to help inform the creation of conservation easements for the Capitol Region Land Conservancy
-Uploading data to The GARDEN Project, a statewide collaboration between universities and VGIN
-Continued research on environmental impacts of the proposed Atlantic Coast Pipeline
-Mapping of local trails with Terrain 360
-Updating and expanding the UR Campus Tree Map
-Proposal for a new National Natural Landmark at Bear Rocks Preserve (Natalie Somerville)
-Natural Resource Conditions Assessment of Booker T Washington National Monument (Heather Courtenay)
-Analysis of Solar Energy Development in the US and Mexico (Kerry McGowan)

For now enjoy one of the first tasks completed by our excellent interns, a map of the construction zones and associated road closures on the UR campus over the summer.

Summer Construction Map

Hope to see you back on the SAL Blog soon!
Taylor Holden

Millennium map experience

Celia Landesberg ’14, a University of Richmond senior and double-major in Geography and Environmental Studies, wrote an article for the online journal Digital America discussing what she refers to as the “millennium map experience.” Read her article here, in which she discusses how cartography has suddenly become an activity in which virtually everybody can—and does—partake.

GIS Day 2013 Preview

GIS Day 2013The Spatial Analysis Lab is excited to host our seventh-annual GIS Day, this Wednesday, November 13, in the SAL from 10:00am to 5:00pm. We have detailed information about the event on our GIS Day page. In addition, you can find more information by following us on Twitter and attending the Facebook event.

For now, however, we want to give you a preview of all the exciting events that will take place this Wednesday, as well as some of the activities that will be happening all day long for our open house.

Events
For a full schedule of events, see the GIS Day page.

  • Guest speakers: Highlights include talks from four UR alumni, current professors, and current students.
  • Our annual geography-themed cake contest! Submit a cake (or any other similar baked goods) to the Spatial Analysis lab by noon on Wednesday. The cakes will be judged based on originality and connection to geography and/or GIS. Prizes are available for the winners!
  • Geography fun and games: Join us for lunch. Rumor is there will be a t-shirt giveaway, a Twitter quiz, and perhaps some other exciting games…

Other Activities
These will go throughout the day, so feel free to stop by the SAL from 10:00am through 5:00pm, sit down at one of our computers, and have fun!

  • “Ask a GIS Expert”: If you have any GIS-related question, our team of professors, staff, and interns will be on hand to help. There’s no question too big or too small that they won’t answer. This is also a perfect way to learn about the GIS capabilities at UR, the data sets we already have, and how you can use GIS in your classes, work, or research.
  • Hands-on GIS for Desktop: Esri, the company that creates the ArcGIS products and sponsors the international GIS Day, has generously supplied some pre-made lessons that guide you through a real-life GIS analysis! This is a great way to learn about GIS, and no prior experience is required. All you have to do is follow easy, step-by-step instructions. The lessons include determining appropriate lynx habitat sites and mapping major features on the surface of Mars.
  • Hands-on GIS Online: Esri has also prepared some fun geo treasure hunts. Use your geographic knowledge to answer a series of questions about major world cities or about mountain ranges, and collect a prize at the end! These interactive treasure hunts showcase web maps from ArcGIS Online.
  • Make Your Own Map: It’s really easy to use ArcGIS Online to create a simple, interactive web map. Follow our easy, step-by-step instructions to create your own map!
  • Mapman Comic Book: GIS Day is fun for all ages! We’ll print you a copy of the Mapman comic book, the only superhero to use geospatial knowledge to save the world! Or at least, to help children sell more lemonade. Have fun learning about GIS while coloring in pictures from this exciting adventure!
  • Certificate of Participation: We know that GIS Day is a big deal, so there’s no better way to commemorate it than with a personalized Certificate of Participation! Just write your name and contact information down on the list, and we will send you the certificate with your name.

We look forward to seeing you on Wednesday for GIS Day!

Summer in the SAL 2013

It’s hard to believe, but in exactly two weeks the new students—the Class of 2017—will arrive on campus to begin their University of Richmond experience. But even though the summer is almost over here at UR, the Spatial Analysis Lab has been a busy place for the past few months! Here are some brief highlights of our Summer 2013.

The SAL team for the Gottwald Games

The SAL team also placed fifth this summer in the annual Gottwald Games—it was our first appearance!

  • The Department of Geography and the Environment welcomed a new staff member in July—and, yes, it’s me, serving as the GIS Technician for the department. This post-baccalaureate position will give me lots of behind-the-scenes experience with running a GIS architecture, will put me in contact with many faculty and staff at the University, and will help ensure that the SAL and its students are achieving as much success as possible.
  • At least three student research projects were based out of the SAL this summer. Two students worked with the Chesapeake Conservancy and used remote sensing software to identify specific areas of land in the Chesapeake Bay watershed that contribute most notably to pollution in the Bay. Two other students continue to work on a Natural Resource Conservation Assessment report for the nearby Shenandoah National Park. And another student made good use of our GPS technology to document lead levels in trees near the Richmond International Airport. These students will present their work and their findings over the next year; stay tuned to the blog for updates!
  • We’ve continued to explore storymaps—interactive, online web maps that are specifically tailored to communicate some information. In the past, we’ve uploaded data to be stored on a cloud computer, but this summer we’ve learned how to store our data locally and serve that data live. So now, when you access a map such as this one showing farmers markets around Richmond or this one looking at the imperial fora of Ancient Rome, you’re seeing a live look at our data. Expect many more customized, interactive storymaps over the next few months.
  • We’ve formed new partnerships with various departments and offices around the University, all of whom are excited to make use of our geospatial resources. For instance, over the next year the SAL will be helping students and staff in the Music Department, the Center for Civic Engagement at UR Downtown, the University Museums, the Digital Scholarship Lab, and even the Office of Emergency Management. We’re also exploring the possibility of incorporating some of our spatial data into the official University of Richmond campus map.
  • Finally, we’ve been preparing for and undergoing a massive hardware and software update. Just today, the Center for Teaching, Learning, and Technology updated the SAL computers and soon we will be receiving a new large-format printer for printing maps. On the software side, all the University computers will now run ArcGIS 10.1 as will our database server and our web server, giving us greater ability to publish maps online. These updates will make sure that UR students are on the cutting-edge of GIS technology.

We’re looking forward to another exciting year in the SAL. Expect much more frequent updates here on the blog, be sure to follow our account on Twitter @UR_SAL, and be on the lookout for exciting online storymaps! And above all, enjoy the final few weeks of your summer.

Student Blogger: Chase Eager


Geography and Health Care

Geography and health care are becoming increasingly related, and in a way that can save lives and promote healthy communities. The relationship between geography and medicine dates back to the 1850s, when Dr. John Snow used cartography to map the outbreak of cholera in London and track the source, a water pump. Today, health care professionals have teamed up with spatial analysts in order to tackle a variety of problems in health care, and in much more advanced fashion than Dr. Snow’s work.

GIS is used in health care on many scales.

GIS can be used in a hospital, such as Loma Linda University Medical Center, where ArcGIS is used to monitor patients’ locations and information throughout their stay. The system tracks patients and their information when they check in, any time they are moved, and when they are discharged. This allows physicians and nurses to stay updated in real time on their patient’s status, which reduces administration costs and makes the process more efficient and accurate.

Jewish Hospital HealthCare Services uses ArcGIS in order to aid employers in helping their injured employees through locating specialized rehabilitation locations close to work. ArcGIS is used to map locations of patients’ homes and workplaces and locate the nearest rehabilitation location, which informs patients of the closest clinic to work. Using GIS, they found that many were not attending the closest because they were unaware that there was a more convenient location.

GIS can also be used to find where there is a need for new clinics. This is done by mapping the location of existing clinics in addition to mapping health statistics and demographics for a county, such as the percentage of the population that is in poverty, the percentage of high school graduates, the percentage of adults with high blood pressure, and the percentage of uninsured adults. This reveals where there is a need for new clinics.

Another phenomenon that has become popular due to Atul Gawande’s New Yorker article is known as hot spotting. This idea was started by Dr. Jeffery Brenner in Camden, New Jersey. He got access to three hospitals’ billing records and created maps of where crime victims lived and where ambulances picked up patients. He discovered that one apartment building had more patients sent to the ER than any other, which was a low-income housing unit. He took this information he learned from mapping high incidents of ER visits in order to start The Camden Coalition, which focuses on giving extra care to the most expensive patients in order to ensure that they stay out of the ER.

Finally, the Dartmouth Atlas has made discoveries that have become popular in health care reform. This project maps variations in health resources and statistics across the United States. They have revealed that there are places that vastly overspend on patients when it is unnecessary, and this greater utilization of care doesn’t yield greater results.

These are just a few examples of how geography is becoming increasingly important in the field of health care. ArcGIS provides advanced technology that helps health providers and policy makers examine health care from a new dimension, giving them greater insight into providing better care.

As a political science major and geography minor, I have combined my interests in geography and health policy through the creation of an independent study called “Mapping Medicine,” where I wrote a research paper on the spatial variation of health care spending across the United States, specifically focusing on Virginia (see sample maps above and below). I am currently doing an independent study in Geography where I am mapping health statistics in the Middle East. I am a member of Pi Beta Phi and a Spatial Analysis Lab Intern. I will be graduating in May and will move to Washington D.C. this summer to begin working.

Story maps with ArcGIS Online

A screenshot of the story map linked in this article“Traditional” maps—those printed on paper and created with GIS software like ArcMap, the software we use in the SAL—are certainly not going away anytime soon. But geographers cannot ignore the fact that Internet-based mapping is quickly exploding in use, allowing virtually everybody to access and to produce their own maps, without requiring any special hardware or expertise.

Esri, the company behind ArcMap, helps facilitate this growth of online mapping through ArcGIS Online, a new product that offers basic map exploration and creation functionality for organizations and for individuals. Users have already created and published thousands of publicly-accessible maps, and more are created each day.

The Spatial Analysis Lab has recently started to explore the potential of ArcGIS Online, especially through the creation of story maps. A story map is one that depicts spatial data but goes further to explain what the data mean and to contextualize its importance; a story map intends to reach a wide audience and to explain the significance of the spatial information.

Students in the SAL began publishing maps in ArcGIS Online earlier this year, and recently, other students have taken some of those maps and turned them into story maps. You can see an early result of the story map efforts here. This story map is only a first step, so far, but it already reveals the great potential story maps can have in communicating spatial information. In general, you can review a gallery of Esri-published story maps here.

Moving forward, students in the SAL are learning how to create maps in ArcMap and upload them to ArcGIS Online, in order to have greater control over map design and content. And looking ahead, students will be adding those maps to a server, so that any changes they make to those maps in ArcMap will automatically be pushed to the story maps published in ArcGIS Online.

Online mapping is a nascent art, so the SAL is excited to be on the cutting edge of spatial analysis. Look forward to more story maps soon!

From Numbers to Spatial Analysis: The Possibilities of GIS in an Academic World

The Middle East definitely receives a substantial amount of global media attention; however, it is often a misunderstood region.  Even outlining the Middle East on a world map creates controversy amongst scholars.  Should the region’s border be based on common history? Language? Religion? Culture?  The fact of the matter is that the Middle East (wherever that may be) has such a diverse background that trying to fit it into these ridged categories does not do justice to its true diversity.  The Middle East Mapping Initiative at Richmond (MEMIR) strives to illustrate the unique characteristics of the contested expanse utilizing a geospatial platform.

Rather than looking at a chart with quantitative data, ArcMap (ESRI’s Geographic Information Systems (GIS) software used by the University) projects statistics onto a map, giving it a place and context – a key tool for young academics unfamiliar with the layout of the Middle East.

In the Spring of 2011 the Middle Eastern geographies class utilized GIS to create informative visuals illustrating key concepts discussed in the classroom.  With no prior GIS experience all of the students executed great maps by extracting data from the University’s extensive MEMIR database.  With these visualizations students learned that Muslim populations are not concentrated in Western Asia, but rather they are more prominent throughout India and Indonesia, clarifying the misconception that the Middle East is the same as the Islamic world (See Example Two).

Students also constructed an illustration of the different extents of the varying definitions of the Middle East (See Example One), and even compiled images to create a mini movie showing the growth of populations in urban areas throughout Middle East (See Example Three).

Urbanization in the Middle East

Example Three: MEMIR Video Illustrating Urbanization in the Middle East and Surrounding Regions


I know for me at least that these exercises really expanded my true understandings of the “real” Middle East.  Therefore, I encourage all academics to employ this powerful technology into their work in some shape or form, and we (the interns) are in the Spatial Analysis Lab to aid in transforming your vision into a tangible and informative project.