Category Archives: Uncategorized

Week 4 Update

Hello Everyone!

We’ve had a busy first few weeks in the Spatial Analysis Lab this fall. From wrapping up our summer projects to starting a new workshop series and everything in between, we’ve barely had a second to sit back and reflect on all the great work going on.

Here’s a summary of some of the great things we’ve done in the first 3 weeks!

  • Finished editing and reviewing GIS campus data for University Police with the assistance of University Facilities: This project started last spring and  continued through summer with us collaborating with Police and Facilities to update campus roads, buildings, and address points to match construction from the previous two years.
  • Wake Up Spatial Wednesdays is a new  weekly workshop taking place every Wednesday at 9 AM in the SAL. Our first three topics were Campus Spatial Data, GIS in Urban Planning with alum Dillon Massey, and Mobile Data Collection using the Collector App. Join us tomorrow to learn about editing Google Maps with Google Mapmaker and suggested edits. Faculty, Staff, and Students of all GIS abilities (or none!) and interests are encouraged to attend!
  • Invasive Species GIS Lab with Biology 199: Once again we worked with Dr. Carrie Wu’s two Invasions in Biology (BIOL 199) courses to collect data using GPS units on invasive species across campus. Students then used ArcGIS to analyze their data and create informative maps for their lab reports. This is the fourth or fifth semester we have completed this lab and it often serves as an introduction to GIS for freshman biology majors who may take GIS courses later.
  • Campus Tree Inventory Lab with Physical Geography Class: Dr. Todd Lookingbill’s Earth Systems and Physical Geography (GEOG 250) course used the Collector for ArcGIS app to collect data on tree species and carbon storage on campus. Their data collection will be incorporated into our ongoing inventory of campus trees and carbon storage that his previous classes and past student researchers have contributed to. They used various equations to estimate carbon storage based on tree diameter, species, and height.
  • Geographers in the Field: Six senior Geography majors presented on their study abroad and internships as part of the Experiential Learning requirement. Students presented on studying in Denmark, Ecuador, the Galapagos Islands, and Australia in addition to research on the Atlantic Coast Pipeline.

We also have many exciting projects to look forward to this semester. A few of them include:

  • Continued Evaluation of Campus Data: We will continue to partner with Facilities and URPD to evaluate campus data layers we have created and updated over the years. These datasets will feed into our campus Authoritative Content that we share with localities and use for research and maps
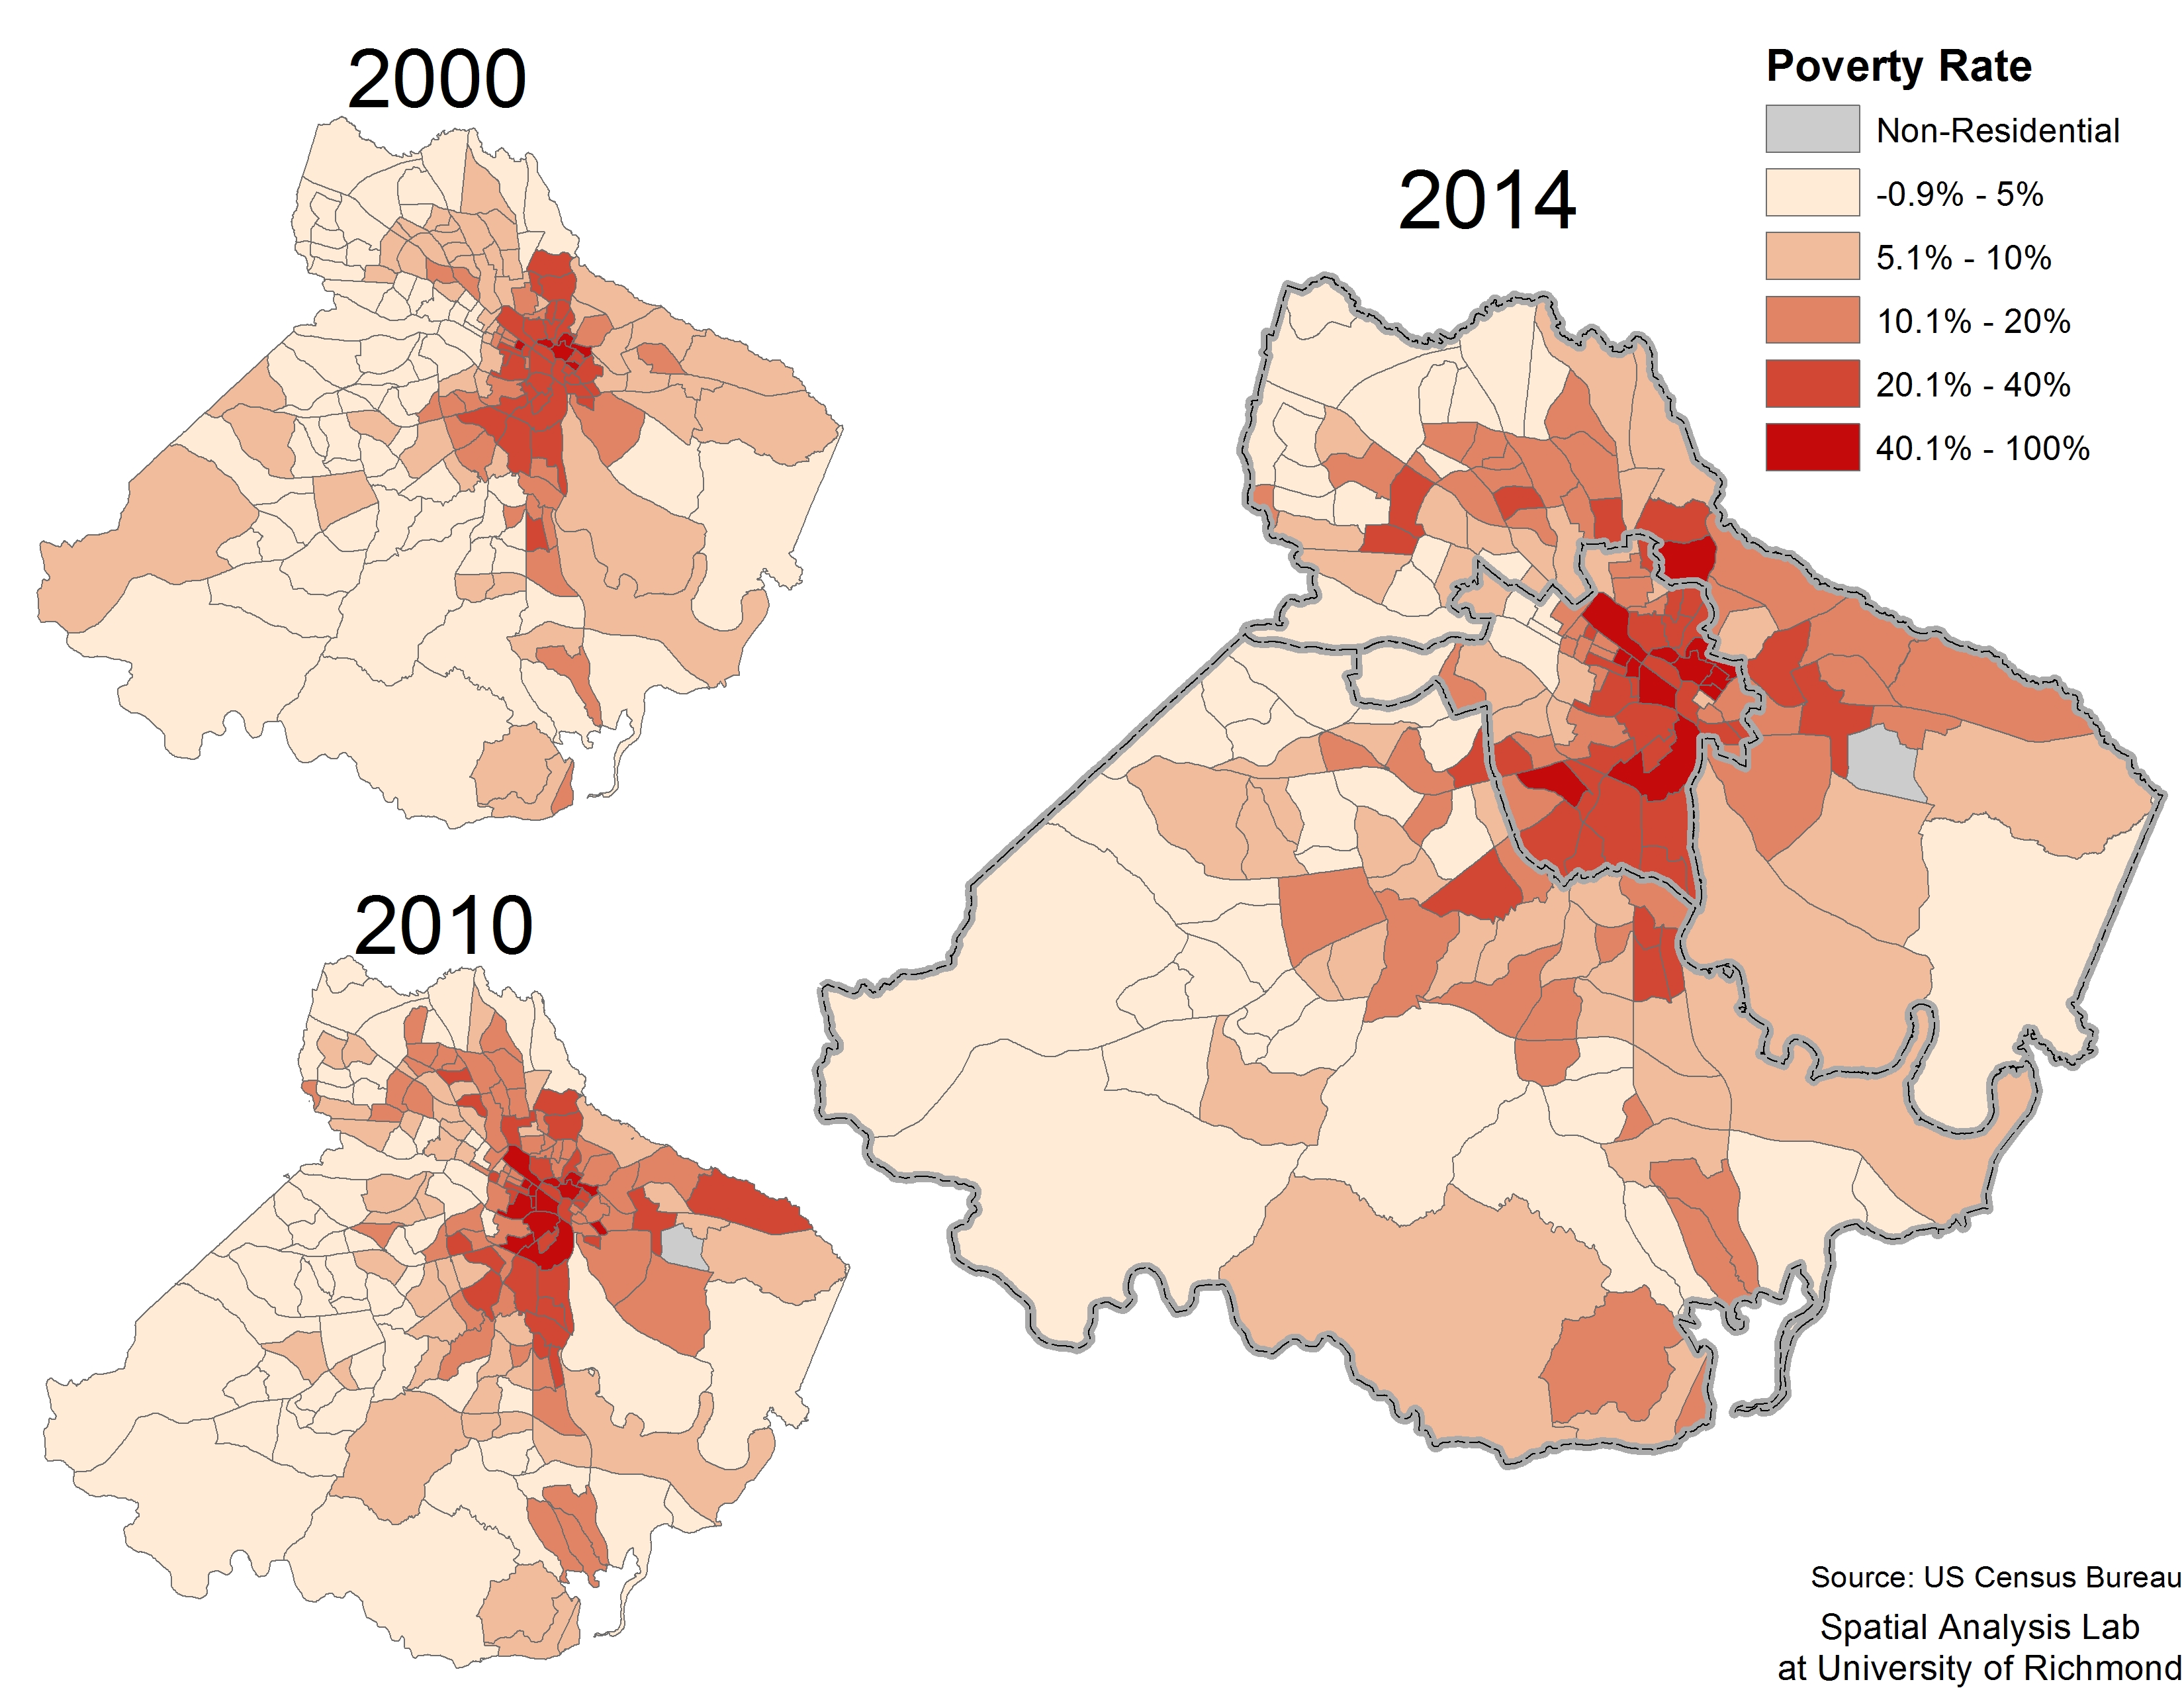
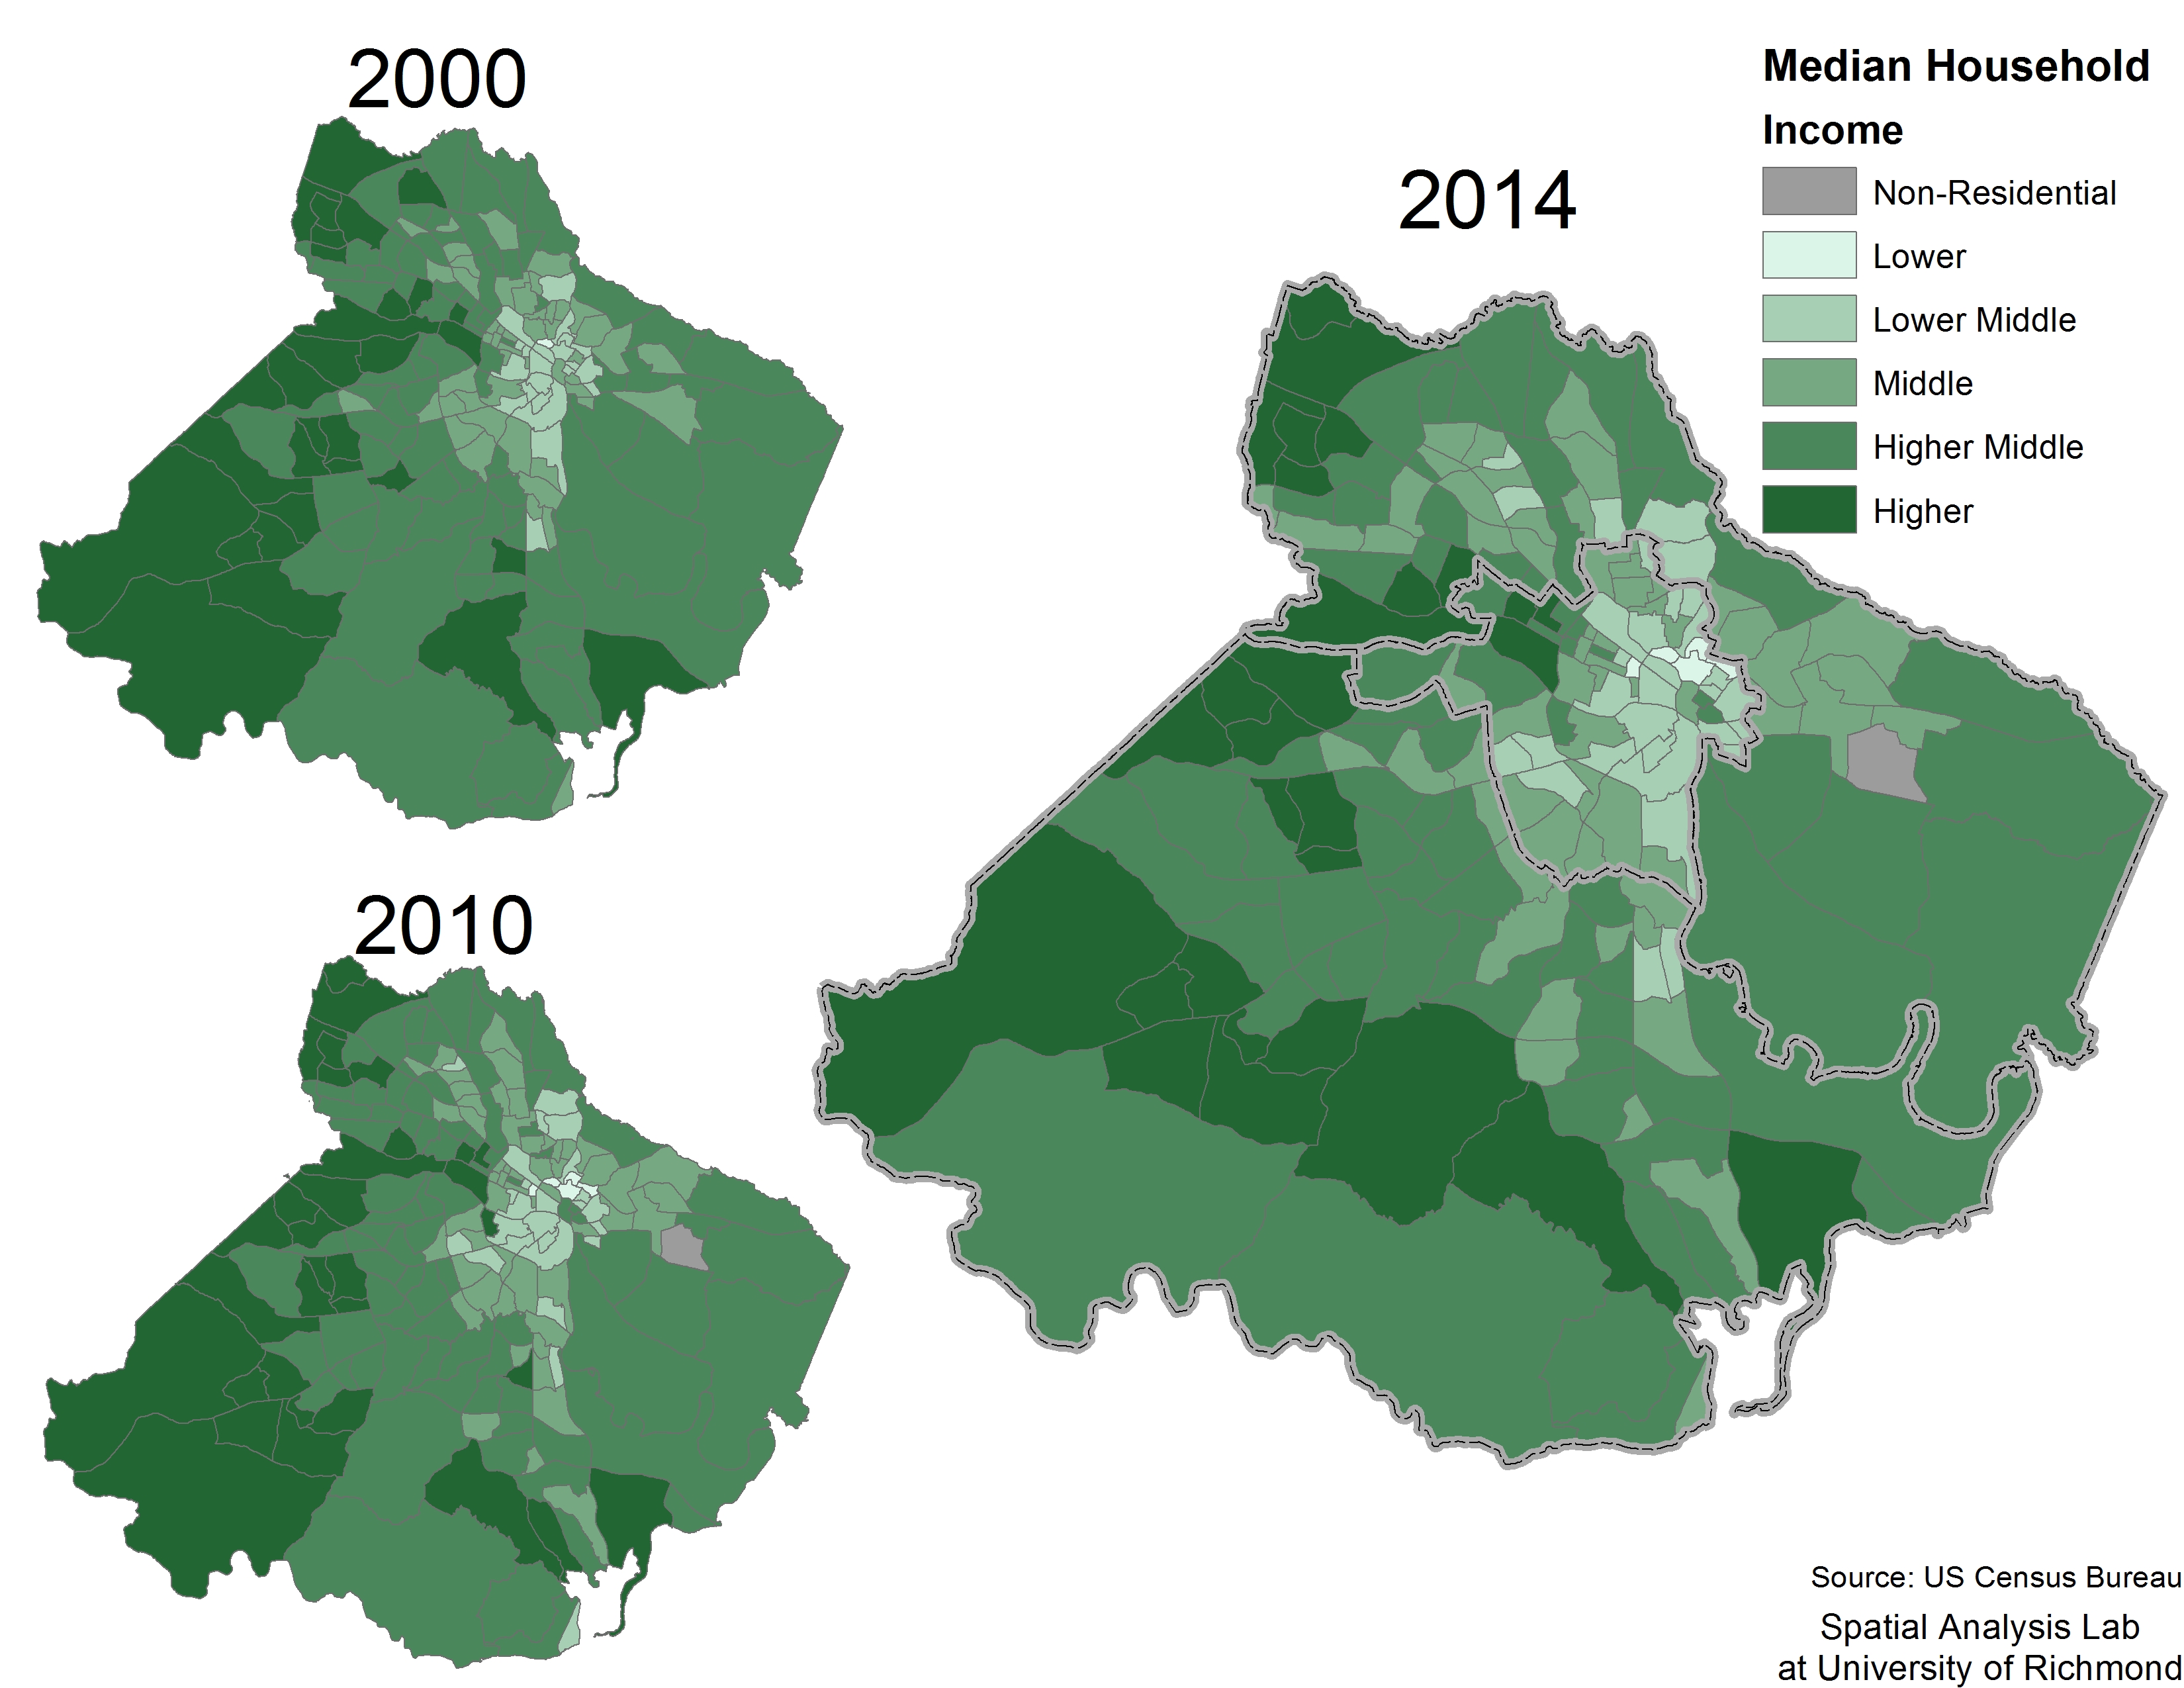
  • Race and Poverty in Richmond with Dr. John Moeser: We will continue our partnership with the CCE in supporting Dr. John Moeser’s decades of research into race and poverty in the Richmond region. This year’s focus will be on data visualization and availability to the public. We will also focus on representing his 1982 book about the Annexation of Chesterfield County by the City of Richmond using new digital mapping and storytelling tools (for an preview click here).
  • Women’s Empowerment in Uganda: We enter our second year supporting Dr. Elizabeth Ransom’s NSF funded project evaluating programs for women’s empowerment through dairy development projects. We will also work with two of her students to add new analysis of water sources to the project’s scope.


Stay tuned for our next post with some exciting opportunities for students and geography nerds!

First Look: Taylor’s Trip to Tanzania

Happy August Everyone! Hope your summers have been as lively and exciting as our’s have been in the Spatial Analysis Lab. As you already know we hosted 4 fabulous high school students for 5 weeks of learning how GIS is in fact at STEM field. However, we have had many other things going on as well!

Director Kim Browne taught her study abroad course on the physical geography of Australia and New Zealand, we have continued supporting Dr, Ransom with her Uganda project, worked with our Facilities, Police Department, and Office of Advancement on some campus GIS projects, but by far the most exciting part of my summer was a 3 week trip to Tanzania!

Earlier this spring I received a staff Weinstein Summer Grant to travel to Dar es Salaam, Tanzania for three weeks. For most of the month of June I visited alumni and nonprofits in Tanzania with the mission of seeing how our GIS students could work with them in the future on internships and/or research projects. I met with: Financial Sector Deepening Trust, Tanzania Open Data Lab at the University of Dar es Salaam, the Department of Geography at the University of Dar es Salaam, and got to visit the Noloholo Environmental Center, which is run by UR alumni Dr. Laly Litchenfeld. I will be making more in depth posts describing what these wonderful organizations do, so stay tuned!

Super Rough Overview of Trip:

  • Spent the first few days in Dar following up my connections.
  • Met with Financial Sector Deeping Trust and the Tanzania Open Data Lab
  • Flew to Arusha (northern Tanzania) to visit the Noloholo Environmental Center. Got to spend the weekend with the kids at the Children’s Environmental Camp
  • Two day safari to Tarangire National Park and the Ngorongoro Crater
  • Flew back to Dar
  • Visited the Department of Geography at the University of Dar es Salaam and sat in on a World Bank Open Data Workshop hosted by the University
  • Trip to Zanzibar before flying home!

This post is mostly a starting point to talk about and show you my incredible trip in Tanzania. I hope these pictures will help inspire students to pursue some of these incredible opportunities that have been made possible thanks to the Weinstein Family and the University of Richmond!

In following posts I will describe the wonderful work our new partners have been completing, list some opportunists our students will have to work with them, and share more in depth reflections on my experience in Tanzania!

Me with the students from the first of three summer camps at Noloholo for the best and brightest from the local Environmental Clubs

Me with the students from the first of three summer camps at Noloholo for the best and brightest from the local Environmental Clubs

When I first arrived at Noloholo the students were learning to make maps of the villages in order to think spatially and about natural resources in the landscape

When I first arrived at Noloholo the students were learning to make maps of the villages in order to think spatially and about natural resources in the landscape

With Raphael Abrahams, one of the recipients of the Noloholo Environmental Scholarship to private secondary school. Raphael was back helping with the summer camps he participated in as a child before heading off to University

With Raphael Abrahams, one of the recipients of the Noloholo Environmental Scholarship to private secondary school. Raphael was back helping with the summer camps he participated in as a child before heading off to University

IMG_1254

Elephant in Tarangire National Park

Also at Tarangire National Park

Also at Tarangire National Park

Clouds spilling over the walls of the Ngorongoro Crater

Clouds spilling over the walls of the Ngorongoro Crater

Me upon descent into the Ngorongoro Crater

Me upon descent into the Ngorongoro Crater

wildebeest herd in the Ngorongoro Crater

wildebeest herd in the Ngorongoro Crater

Some baboons while leaving Ngorongoro Crater

Some baboons while leaving Ngorongoro Crater

With Dr. Herbert Hambati, (outgoing) head of the Department of Geography

With Dr. Herbert Hambati, (outgoing) head of the Department of Geography

Sitting in on a World Bank Open Data presentation at the University of Dar es Salaam. Experts spoke about using new elevation data paired with updated Open Street Map data to better plan evacuation routes during floods in Dar and other cities in Tanzania

Sitting in on a World Bank Open Data presentation at the University of Dar es Salaam. Experts spoke about using new elevation data paired with updated Open Street Map data to better plan evacuation routes during floods in Dar and other cities in Tanzania

View of Dar at night

View of Dar at night

Feeding giant tortoises at Prison Island, just off Zanzibar. Some were over 300 years old!

Feeding giant tortoises at Prison Island, just off Zanzibar. Some were over 300 years old!

Sunset in Zanzibar

Sunset in Zanzibar

Unpacking the Census: Mapping Poverty in Metro Richmond

Post by Olivia Mobayed ’16

There is no doubt that poverty is a big issue in Richmond.  A high proportion of Richmond children grow up in households that live below the poverty level, and a majority of Richmond Public School students receive free or reduced price lunch. Dr. John Moeser has been studying trends relating to poverty in the Richmond region for decades, and I was lucky enough to assist him this past year in his research.

Along with SAL GIS technician, Taylor Holden, I was able to track changes in poverty, unemployment, and household income not just for Richmond, but also for the larger Richmond region.  With new data from the American Community Survey, we updated past maps from Dr. Moeser’s research to show 2014 5-year estimates (estimations from the American community spanning from 2009 to 2014). With updated visualizations, we were able to map poverty not just in the city of Richmond, but also how it has changed in the suburbs.  We were able to conclude that poverty is spreading outward, and has become a regional issue.

With our findings and maps, we were able to present to various community groups.  We presented at church groups, the Richmond City Health District, and at the Richmond Times Dispatch.  By utilizing maps, we were able to share our findings with ease, keeping our audiences engaged and informed.  Our presentation sparked conversations about policy, history, segregation, transportation, gentrification, and next steps in preparing a regional response.

Poverty in Richmond, Chesterfield, and Henrico 2000-2014

Lucky for you, the maps and additionally slides from our presentation are available on the University of Richmond library website! Keep updated, because more discoveries are coming in the following months.  We hope to study transportation trends within the region – where commute times are longest, and which places use specific transportation types (automobiles, busses, bicycles, and others) more than other places. We are also considering different ways to make these maps online and interactive in order to allow viewers to interact with the data and easily compare various demographic variables (for example, showing poverty rates and unemployment rates side-by-side).

Median Household income in Richmond, Chesterfield, and Henrico from 2000-2014

Median Household income in Richmond, Chesterfield, and Henrico from 2000-2014

When I first found out about Dr. Moeser’s research, I was so excited to be part of it!  I have always been interested in the human side of geography, and mapping demographics from the region I spent the last four years of my life in sounded like a dream come true! Indeed, spending time on this project has made myself even more confident in my plan to continue my study of people and the places they inhabit and interact with.

This summer, I am mapping various measures of health and equity in the Richmond region, thanks to an opportunity I was given following one of our presentations.  This fall, I will begin working towards my Masters in City & Regional planning.  Although I will not be in Richmond, this research opportunity has been an invaluable experience in understanding demographic trends and the complex system of forces behind them as they relate not just to Richmond, but the whole world. There is no question in my mind that this research opportunity would not have been possible for me without the help of the SAL.

Here is an interactive web map of the data I prepared from 1990-2014 for my Maps and Geovisualizations course. It can be seen larger here


Thank you, Dr. Moeser & the SAL!


Olivia graduated from UR in May 2016 and will begin a Masters of City Planning at the University of Pennsylvania this fall. She will focus on transportation planning and applications of GIS

MSI Week 3 – Field Work

This week our wonderful MSI students took their experience outside the lab and completed some fieldwork. They contributed to our campus tree inventory, which I actually started 4 years ago in the summer after my freshman year. We collected species, diameter, height, and location for over 800 trees on campus and estimates how much carbon they stored. The original inventory can be found below:

This past year students in our Earth Systems and Physical Geography course (GEOG 250) have been adding trees to the map using GPS units and the ArcCollector app. Our MSI students got to do so as well! Without further ado, here is the experience in their own words:

Shanaya

Starting this week we’ve participated in field work. It was very interesting and it provided a fun experience. Markee and I evaluated many different trees outside of the lab. I measured the height using the laser Rangefinder and Markee focused on diameter of the tree. Together we managed to figure out the name and species of the trees. My favorite part of the field work was interacting with my partners and realizing how much information you can get about a tree by only using a few tools.

Markee

The field work I’ve been doing outside for GIS at the University of Richmond was a little tough at first. I really didn’t know how to use any of the tools.  Measuring the trees can be tiring but the results are worth it. The tool I like using the most is the laser Rangefinder. It measures how tall the tree is in meters. I like finding out what type of species the tree is. That’s the part that takes the longest.

Students using the laser range finder, after having measured their distance from the tree using the tape measure on the ground.

Students using the laser range finder, after having measured their distance from the tree using the tape measure on the ground.

Jonathan

My name is Jonathan and I learned and did a lot during these sessions of field work. We started off with having to know how to calculate the Diameter at Breast Height (DBH) of a tree. Then we learned how to calculate the height of the tree using degree measures on a Rangefinder. Then we did some review and practiced with finding GPS locations and reading coordinates. Once these objectives were completed we went out and put what we learned to the test. At first we had to use a sheet and write down the information. Then we used an app created by ESRI, so we could enter all the information on our phones and it logged the tree into the ArcCollector app on a map. So from this experience I learned a lot and had fun as well.

Stephon

We have been trying to figure out ways to solve global climate change. Tons of greenhouse gases such as carbon dioxide are emitted every day. These gases overheat and pollute the environment, and will gradually get worse over time we don’t do something soon. Since trees are able to store carbon dioxide, we have been researching exactly how much carbon dioxide various species of trees are capable of sequestering. Over the past few weeks, we have been conducting fieldwork at the University of Richmond to determine the amount of carbon dioxide different trees can store. We use DBH (Diameter at Breast Height), range finders, dichotomous keys, and global positioning systems to gather data of the trees on campus. I hope that the data we gather of tree sequestration can be used to help solve global climate change.

Newport News Students Explore Environmental Issues in their Community with GIS

Post by Dr. Mary Finley-Brook

Children from the Southeast Care Coalition and Southeast Asthma Network of Newport News attended a workshop in the Spatial Analysis Lab (SAL) on December 5, 2015. SAL Intern Jared Goldback Ehmer (’17) led a Google Earth demonstration examining social and environmental issues in the children’s neighborhood. The workshop was taught with assistance from Don Edmunds (’17) and Izzy Pezzulo (’18), students in Professor Finley-Brook’s Local to Global Living Learning Community. The mapping exercise demonstrated spatial proximity between schools the children attend and a coal export plant, highway, shipyard, and various industrial sites generating air emissions harmful to public health.

1  35

Nearly twice as many children in Southeast Newport News live with asthma than the national average. For African American children, asthma is the leading reason for school absences and hospital visits, according to the Centers for Disease Control and Prevention. At the December 5th workshop, Dr. Erica Holloman, Program Coordinator for the Southeast Care Coalition, shown below with her newborn son, discussed how the lack of green space and trees in Southeast Newport News exacerbates respiratory disease. Increasing vegetation, such as by planting trees, would improve air quality in this neighborhood predominately covered by paved surfaces.

Dr. Erica Holloman, Program Coordinator for the Southeast Care Coalition and her newborn son

Dr. Erica Holloman, Program Coordinator for the Southeast Care Coalition, and her newborn son

The Environmental Protection Agency (EPA) has identified Newport News an as environmentally overburdened, underserved, and economically distressed area. With the Making a Visible Difference in Communities Program, the EPA provides technical support to the Southeast Care Coalition for environmental programs. Environmental Studies faculty members at the University of Richmond, including Mary Finley-Brook (Geography) and Kristine Grayson (Biology), are forging a partnership with Southeast Care Coalition to support and participate in community-based air and water quality monitoring.

For more information, contact Mary Finley-Brook (mbrook@richmond.edu) or check out her website.

8


GIS Day 2015

Capture

On Wednesday November 18th GIS nerds across the globe will come together to celebrate all things GIS! As always we’ll have our fabulous cake contest to see who can win for their creativity and design skills! Check out some of the awesome things we have planned below:


Schedule

9:00-10:00  – Breakfast Welcome/Open House
10:00 -11:00  – Model Builder and Python Workshop
11:30-12:00  – GIS and Epidemiology: The Spread of Lyme Disease
12:00-12:30  – Campus GIS Showcase
12:30-2:00  – Open House and Campus Geocaching Activity
2:00-2:30  – Race and Poverty in the Richmond Region
2:30-3:00  –  Campus GIS Showcase 2
3:00-4:00  – Cake Contest voting
4:00-5:00  – GTU Induction Ceremony and Party!


Details

Breakfast Open House- Join us for coffee and bagels as we discuss the big day ahead and answer any questions you have about GIS or the Spatial Analysis Lab.

Model Builder and Python Workshop: Come learn how Model Builder and some simple Python scripting can automate your analysis and procedures to save you tons of valuable time! Taught by our wonderful intern Tracy Tien, this one is a can’t miss for anyone using GIS

GIS and Epidemiology: The Spread of Lyme Disease – Senior intern Shaquille Christmas will present his independent study with Dr. Jory Brinkerhoff about the  spread of Lyme disease within Virginia and how GIS is helping them research and track it.

Campus GIS Showcase – Dr. John Scrivani and GIS Technician Taylor Holden will showcase some of the many student projects using campus as a living lab over the past several years. In addition they will show some innovative uses for LiDAR data in campus asset management. Other topics will include tree inventory, carbon storage, illumination safety mapping, and field collecting data with ArcGIS Online.

Campus Geocaching Activity – Join the UR Geography Club for a fun adventure mapping various campus infrastructure elements. This crowd sourcing activity will showcase how data can be collected by a variety of stakeholders for many different projects. Prizes will be won!!!!

Race and Poverty in the Richmond Region –  Watch senior intern Olivia Mobayed discuss assisting Dr. John Moeser with his research into race and poverty in the Richmond Region. This ongoing and highly influential project has found a new home in the SAL where we will help expand his analysis and dig deeper to further explore inequality and changing demographics in our region.

Cake Contest – Enter your most creative geography or GIS themed cake/cupcakes/desert for a chance at three prizes! Awards are based on creativity and cleverness, so no baking skills needed! Feel free to bake your own or purchase pre-made cakes to decorate.  Drop your cake off early in the morning for everyone to admire! For ideas check out some of our past entries below.

Gamma Theta Upsilon (GTU) Induction Ceremony – Join us a we induct new members into the UR chapter of the International Geography Honor Society. Cake and other refreshments will be served as celebration!

Some past GIS Day Cakes:

Adrian_Carly GIS_cakes Klinker and cake

IMG_1146


Resources for Learning ArcGIS – Self Guided

Hi All,

In the first few months of my position as GIS Technician here in the SAL I have had multiple conversations with students, faculty, and staff who would like to learn to use GIS, but do not have the time to take a full course. One of the wonderful things about ArcGIS (and there are many!) is that ESRI provides great support for learning to use the various tools and products. I often find the online help to be useful when performing a new analysis or trying to get a tricky map to look good. However, there are also countless other resources available for learning GIS from the beginning. Here’s a list of a few of the resources I’ve been directing people to.

Here is a free course from ESRI  (the company that makes the ArcGIS software) for getting started. It’s about 4 hours long broken into different modules.

http://training.esri.com/gateway/index.cfm?fa=catalog.webCourseDetail&courseid=2500

These videos by Harvard University might be useful as well for getting started.

http://hcl.harvard.edu/libraries/maps/gis/tutorials.cfm

And here is a workbook resource from University of Maryland for learning GIS with a little more depth.

http://www.lib.umd.edu/binaries/content/assets/public/gov-info-gis/research-and-instruction/introduction-to-gis-workbook.pdf

Lastly, Kim and I have signed up for a new MOOC (Massive Open Online Course) offered by ESRI called “Going Places with Spatial Analysis”. Here’s a screenshot of the website to give you an idea what the course is about. We are planning on hosting SAL lunches every Wednesday at noon to discuss the past week’s lesson and create space for all those learning GIS to network and get to know each other. If you would like to join us show up on Wednesday September 9th or email me ahead of time to let me know you’re interested. Here is the link to the sign up!

http://www.esri.com/landing-pages/training/spatial-analysis?utm_source=esri&utm_medium=redirect&utm_campaign=MOOC

Capture

As always, if you have any questions feel free to contact me or drop by the SAL in INTC 300!


Best,

Taylor Holden

GIS Technician

taylor.holden@richmond.edu

Natural Resource Condition Assessment for Booker T. Washington National Monument

Post by Heather Courtenay ’16

In the background of the rest of the SAL research, Dr. Lookingbill and I have been working on revisions for a paper that was started last summer on Booker T. Washington National Monument (BOWA). The paper is a Natural Resource Condition Assessment (NRCA) for the National Park Service, which is formulated to assess and record park resource conditions, accompanying more traditional threat-based assessments. An NRCA reports on the current and trending conditions, data gaps, and confidence levels for selected park natural resource indicators. The report can be used by park managers to address park priorities, identify data needs for resources, and further communicate park resource conditions to wider audiences. The goal of the report is to provide information based on scientific data and analysis, which can then be used in park planning and partnerships.

Booker T. Washington National Monument memorializes the birthplace of one of America’s most influential African American, Booker T. Washington. The site was established as a National Monument in 1956 by Congress. Today, BOWA is a 239 acre park that contains many interpretive replicas of buildings and farm installations, as well as a visitor’s center and an old school building. The park is within the Piedmont region of Virginia, and is situated in the Roanoke River and Albemarle Sound watersheds. Threats to the park’s natural resources are found inside the park (e.g., invasive species, erosion), outside the park boundaries (e.g., water contamination), and the greater region (e.g., air pollution).

1

Key Characteristics of Booker T. Washington National Monument in a conceptual diagram showing the natural resource assets and stressors in and around the park.

Multiple metrics are used to assess the health of the park, and datum must be collected from various monitoring reports, such as the National Park Service Inventory and Monitoring Program, and park-specific databases. Once the 16 vital sign metrics were identified, a threshold level was set based on scientific literature and management goals. This threshold acts as a reference point from which to gauge the status of the vital sign. Attainment of thresholds for each metric were calculated from the percentage of sites or samples that reached or exceeded the threshold value. A metric attainment score of 100% indicated that the metric met the threshold identified to maintain the resource in all instances. Once all of the attainment scores were calculated, an unweighted mean was calculated to assess the condition of each vital sign category for the park as a whole. The natural resources of BOWA were found to warrant moderate concern, reaching 57% of desired thresholds.

Vital sign categories and metrics used in assessing of Booker T. Washington National Monument

Vital sign categories and metrics used in assessing of Booker T. Washington National Monument

In order to give visual context to the report, many maps and figures were created to represent things like geologic formations, sampling points, and watershed contexts. Most of my job this summer has been standardizing these maps to a set format, as well as resolving data gaps. Supporting the large amount of data contained in the NRCA with comprehensive maps significantly increase the accessibility of the information, which is vital in a public arena such as the National Park Service.

Watershed Context of Booker T. Washington National Monument, in the Upper Roanoke River Watershed

Watershed Context of Booker T. Washington National Monument, in the Upper Roanoke River Watershed

GIS in Action: DC2RVA Field Trip

Post by Shaquille Christmas ’16

A couple weeks ago we visited the Richmond office of  Henningson, Durham, and Richardson, Inc (HDR), which is an architectural, engineering and consulting firm based in Omaha, Nebraska. UR alum and former SAL researcher extraordinaire Bridget Ward recently started working there as a GIS consultant in the transportation division. Bridget and her colleagues spoke to us about the DC to Richmond South East High Speed Rail project they are spearheading the planning for. They detailed the different ways in which HDR uses Geographic Information Systems (GIS) to support not only the DC to Richmond rail project, but also many of their other projects. These uses include preparing bids for contracts, performing analysis for various departments before and during construction, and especially communicating with the public. Below is a map they created showing the proposed rail route.

DC to Richmond (2)

One of the other interesting projects they talked about was an expansion of Route 460 that was delayed and ultimately drastically changed due to another contractor using inaccurate data to make decisions about impacts on wetland health. Since we have worked with wetland data on several projects over the summer it was cool to see how important accurate and detailed analysis is, and how detrimental careless errors can be!

20150710_131235

Overall, our time spent at HDR was both invaluable and inspiring. Bridget and her team gave us several homework projects of cool tool and methods we should learn to prepare for working in a professional and team environment. It is my hope that other students are getting experiences such as this, and are receiving advice on how to best put their GIS skills to use as they consider potential career paths.

20150710_125058

Proposing a New National Natural Landmark: Bear Rocks, WV

Post by Natalie Somerville ’17

Hey friends! I’m Natalie and I have the good fortune of doing research with Todd Lookingbill during May and June of this summer. I am working on writing a proposal to the National Park Service to suggest adding a new landmark to their National Registry of Natural Landmarks.

picture 1

Now, if you are unfamiliar with the concept of National Natural Landmarks, let me explain a bit: they are not equivalent to the status of National Parks; I am not proposing a new National Park, sadly, although that would be pretty sweet. When the NPS gives a site the designation of “National Natural Landmark,” it means that the specific site is the best representative example of some geological or biological feature within a physiographic region of the United States.

Appalachain Plateau1

Map of Appalachian Plateaus prepared by the S4 Interns

The Appalachian Plateaus province of the U.S., which goes from Alabama to New York (see figure above for a map of the 7 sections within the Plateaus region; the site I am researching is located on the eastern edge of the Allegheny Plateau section in West Virginia), does not have any National Natural Landmarks designated within it to represent the geological feature of a plateau. …No plateau landmark within the Plateaus province..? Seems like a major gap. And here is where my project comes in! I am researching the geology and ecology of an area of land in West Virginia called Bear Rocks, in hopes of writing a report to the National Park Service saying why Bear Rocks should be considered as a new landmark to represent the plateau theme.

picture 3

Bear Rocks is already a Preserve, owned and managed by The Nature Conservancy, so there would be no extra protection given to the area even if my proposal is accepted and this site becomes a new landmark. I began research on this project with a few classmates in my SSIR (Protected Lands of the American West) this past semester, and our whole community took a weekend trip to the site. When you actually go to the Bear Rocks Preserve and run up the rocks to stand on the edge of the plateau, looking out over the vast horizon over to the Blue Ridge Mountains, it is clear how well this area of land demonstrates the features of a plateau. Plus, you get some pretty good views of the sunrise:

picture 4

I conducted a site visit to Bear Rocks in mid-May, a trip that included a meeting with the Land Conservation Practitioner for the West Virginia chapter of The Nature Conservancy. It was very helpful to talk to someone who has worked in and around this area of land for several years and knows what is important about it. Something it made me learn about research in general: I may do various internet searches and think I know information about a place, but talking to people who are familiar with the topic or subject of research will bring invaluable knowledge and clarity to the project. This research project is a team effort and cannot be completed without many different voices and areas of expertise.

picture 5

We are certainly moving forward in the information we know and making progress with writing the report! There is still a lot to be done, but I and the people involved with this project are expectant and hopeful that Bear Rocks will prove to be the best candidate for a National Natural Landmark designation, representing plateaus.

picture 6