Category Archives: from the director’s desk

Thoughts, messages and reflections from the Director of the Spatial Analysis Lab – Kimberley Klinker.

Summer 2018 in the SAL….and Kenya!

By Kim Browne, SAL Director

The Spatial Analysis Lab has been a hub of activity since spring classes ended and we said goodbye to our graduates. Colleagues from Biology and Classics have been in and out of our space collaborating on the East End project, Rock Pools and more. Justin Madron from the Digital Scholarship Lab taught a short Story Maps workshop and Nadia Hatchel provided training on Survey 1, 2, 3. We are grateful for all of their talent. Soon we will say bon voyage to our GIS Technician, Taylor Holden. Taylor’s dedication to our mission will be missed. Thankfully, we’ve hired a new technician who will begin later this summer. More on that later.

For the last few weeks I’ve been working with three undergraduate students to prepare them for a month-long stay in Nairobi, Kenya. The students have each been awarded summer research funds through the University and travel funds through the Office of International Education. Our work is part of a larger project with Dr. Sandra Joireman, the London School of Economics and the Kenyan National Lands Commission. The bulk of our work involves helping to inventory, georeference and digitize a set of historic Settlement Scheme maps for the National Lands Commission. The three student researchers completed our Introduction to Geographic Information Systems (now Foundations of Geospatial Analysis) this past spring. The work in Kenya is an incredible opportunity for the students to synthesize course concepts, learn new techniques, and contribute to the research of our collaborators in substantive ways.

It has been rewarding to think about all of the different technical pieces required to make this project happen. Hearing my students say things like, “oh, I remember doing that in class” is one thing. Watching them pull together a workflow and technical document for this project is yet another. It’s incredible!

Besides the technical aspects of the work, there are other challenges (cultural, time, being Mzungu). During one of our recent mornings we spend almost 3 hours trying to understand some of the collar information on a map … only to find that what we thought was an “8” was an “&”. What a great lesson as we start this journey! How many “&”s hidden as “8”s will we encounter along the way? Could it be we don’t know nearly as much as we think we know? Can we open up enough to admit our ignorance? Are we, the experts, ready to learn?

Lauren, Meg, and Griffin prepare for Kenya

Do These Buttress Roots Make My Trunk Look Big?

Post by Kim Browne 

The past four summers I’ve had the good fortune of leading students to Australia for an intensive field experience which includes visits to two World Heritage sites: the Wet Tropics of North Queensland and the Great Barrier Reef. These sites are connected (literally and littorally) by the rain that falls along the narrow strip of forests along the mountainous coast, by the sugarcane fields the rivers pass through on their way to the sea, by the mangroves which filter nutrients and sediment, and by a thousand other processes that are critical to the health of these important ecosystems.

But today, the main connection I want to write about is the one I felt to my study abroad as an undergraduate at James Madison University in the summer of 1987. During this intensive field biology course in the Ecuadorian rainforest and the Galapagos Islands (think Darwin) we saw buttress roots, crossed altitudinal gradients, and witnessed things few people ever witness. How many people get to swim with sea lions in the Galapagos? Witness blue-footed booby’s feeding their young? Watch an anaconda slide off a log into the river?

My friend Emily in the Ecuadorian Amazon with a tree with large buttress roots

My friend Emily in the Ecuadorian Amazon next to a tree with large buttress roots

I’m very fortunate to have had those experiences and my students are equally fortunate. Many of the Islands I visited in the Galapagos nearly 30 years ago are now closed to visitors (due to damage and pests). Lonesome George, a giant tortoise we saw at the Charles Darwin Research Stations died in 2012.  The Amazon is in trouble.

I wonder and worry about the Reef. I wonder if in 30 years my students will be reminiscing about that thing of the past called the Great Barrier Reef.  Snorkeling this year (after unprecedented coral bleaching) was striking and saddening compared to my experience just one year ago. The reef is in trouble. The destruction of these large rainforest trees (aka carbon storage tanks), combined with other factors (including carbon emissions from our flights), is putting the reef in serious danger.

I’ve since returned to my lab where four high school students are being mentored by two of my lab interns. The students are contributing to an inventory of trees on campus. They are recording the GPS coordinates, diameter, height, and species of trees. Using this information they will estimate biomass and carbon stored. The data collected will help us better understand the role of trees in our world and will help the students connect the trees they see every single day to things like the Great Barrier Reef and Global Climate Change.

Giant fig tree in the Paluma Rainforest

Elaborate root structures in the Paluma Rainforest


from the director’s desk

TIME Magazine recently published this disturbing image titled “A Map of Trouble” (TIME, Jan. 3 2012; 26-27).  My response and my counter-map are inspired by the work of Mark Monmonier (How to Lie with Maps) and J.B. Harley (Maps, Knowledge and Power).

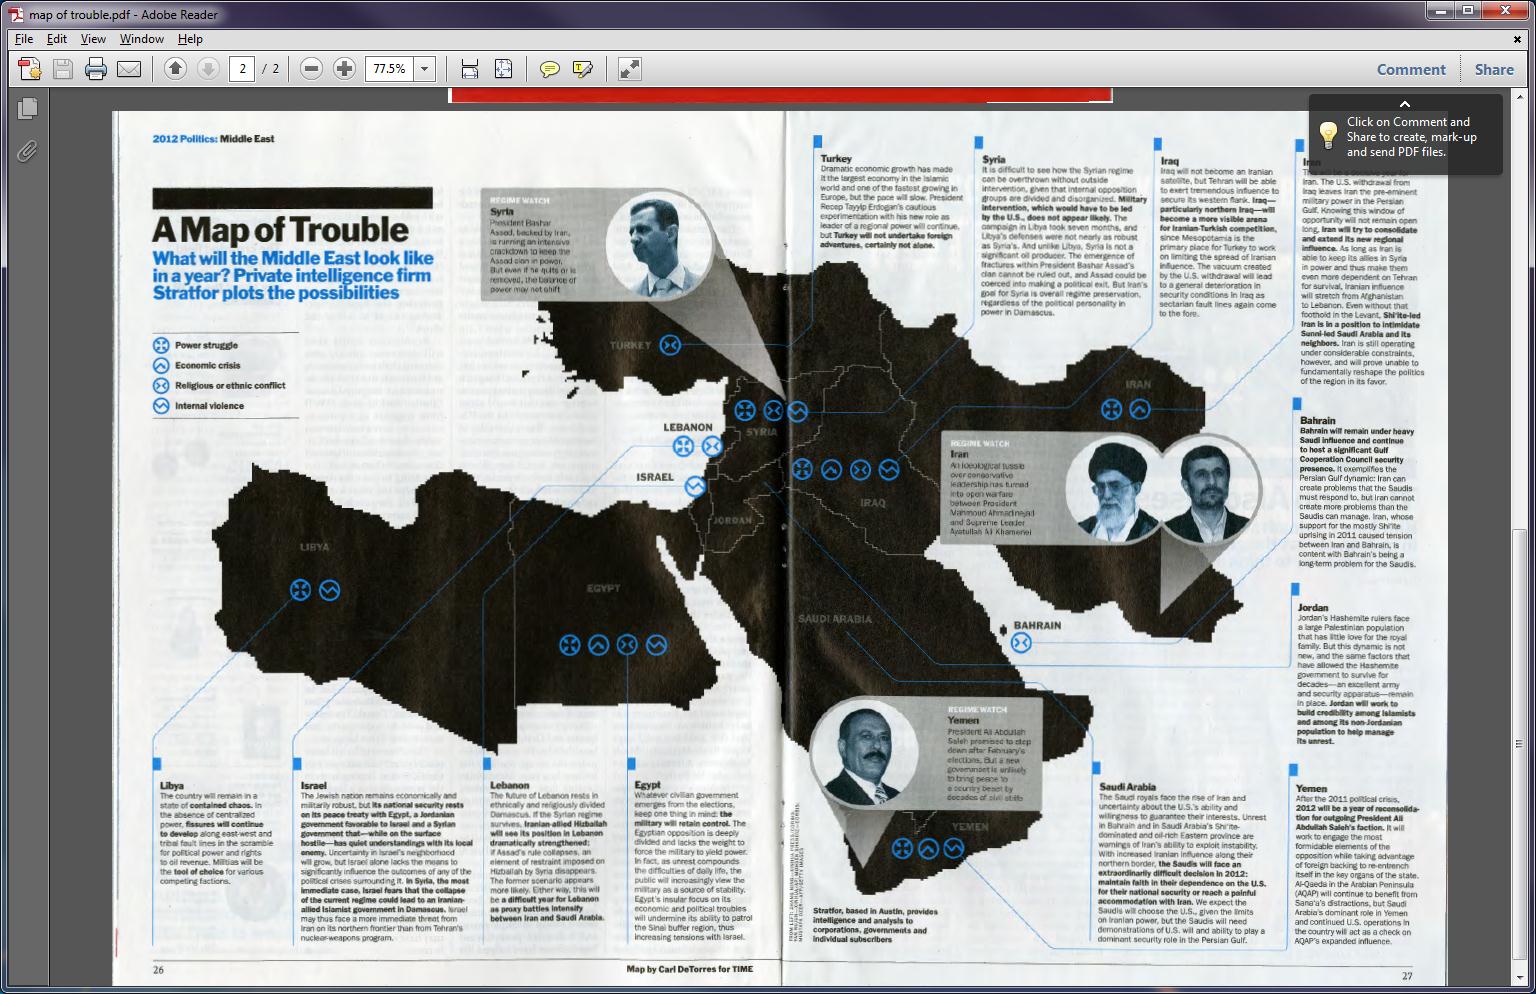
First, the title and the graphic shape of the “region” are linked together in the reader’s mind.  Trouble = Middle East = Bad is the not-so-subtle message.

TROUBLE  =   

In the same way that:

LOVE  =   

and

HAPPY =

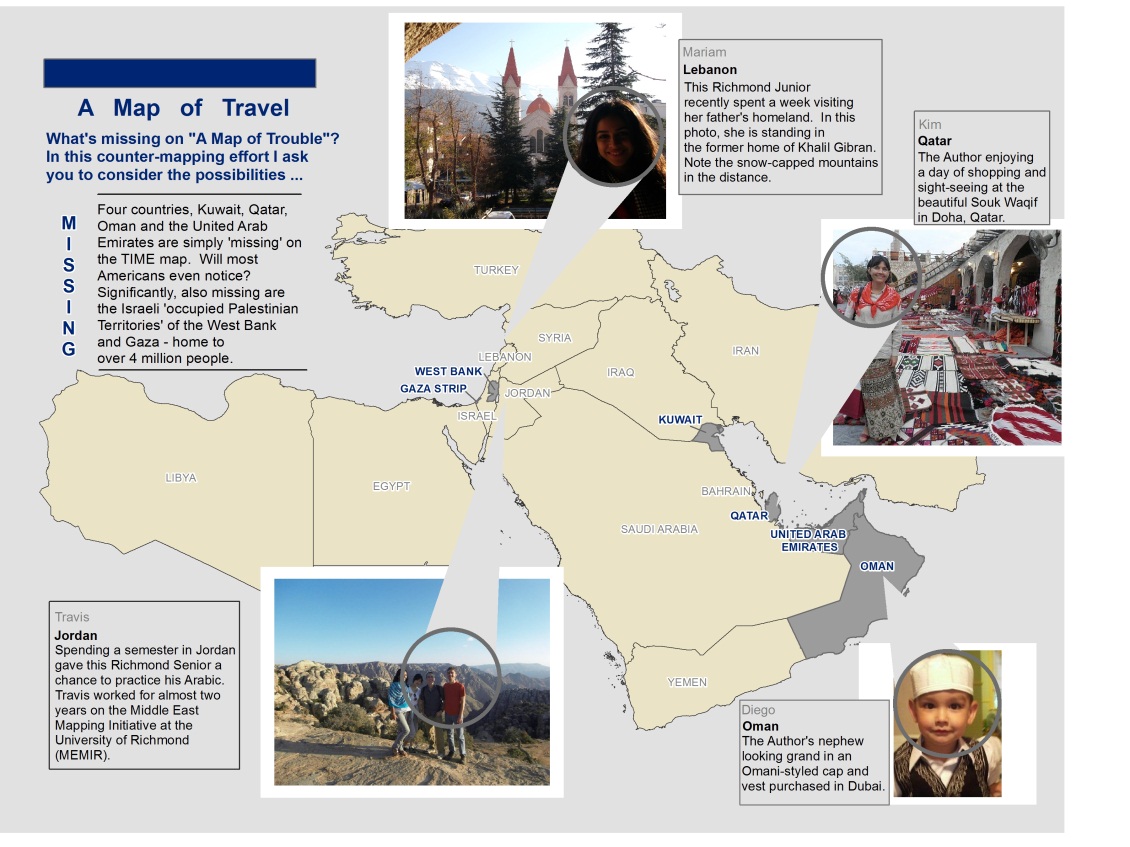
Second, the lack of color, the choice of markers resembling hazardous waste dumps, and grey-scaled photographs of men (disturbing ‘others’) help to reinforce the negative message of the map.  Contrast these with the colorful photos included on my “Map of Travel”.  For Harley, “maps are never value-free images.”  “Both in the selectivity of their content and in their signs and styles of representation, maps are a way of conceiving, articulating, and structuring the human world which is biased towards, promoted by, and exerts influence upon particular sets of social relations (Harley 278).”  “A map can carry in its image such symbolism as may be associated with the particular area, geographical feature, city, or place which it represents (Harley 279).” How might our perspective change if we were constantly bombarded with maps and images of smiling people, beautiful scenery and colorful markets?

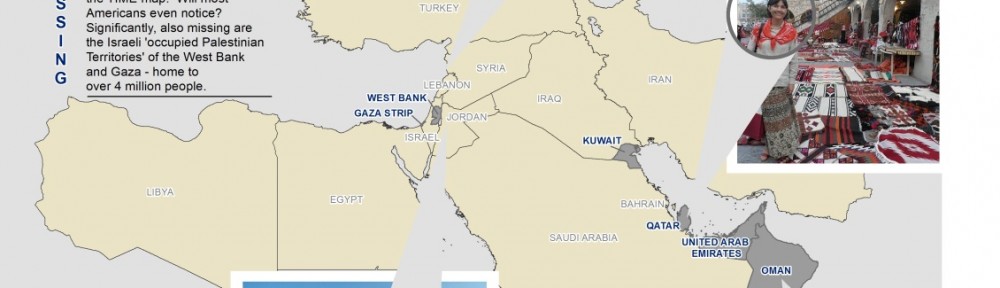
Third, the map contains several blatant omissions.  The countries of Kuwait, Oman, Qatar, and the United Arab Emirates are simply NOT THERE (neither is Afghanistan or Cyprus for that matter).  The four absent countries fall within the extent of the map – will they not be missed?  Why were they excluded?  Harley says “maps – just as much as examples of literature or the spoken word – exert a social influence thru their omissions as much as by the features they depict and emphasize (Harley 290).”  Significantly, the Israeli-occupied territories of  the Gaza Strip, and the West Bank (aka the PALESTINIAN TERRITORIES) are neither on the map nor mentioned in the vignette.  Could this be a case of the “predictive art of using maps to project and to legitimate future territorial ambitions? (Harley 289).”  Or was this simply an oversight?

“Map users seldom, if ever, question these [the map makers], and they often fail to appreciate the map’s power as a tool of deliberate falsification or subtle propaganda (Monmonier 42-45).”  “Savvy map viewers must recognize that not all maps are intended solely to inform the viewer about location or geographic relationships.  As visual stimuli, maps can look pretty, intriguing, or important.  As graphic fashion statements, maps not only decorate but send subtle or subliminal messages about their authors, sponsors, or publishers (Monmonier  43-45).”

Counter-maps – maps of peace, maps of potential – maps of nuance – must be created and shared to balance overly simplistic and negative maps.  This is one of the chief motivations behind MEMIR – the Middle East Mapping Initiative at Richmond.  Join us!


from the director’s desk

Got GIS?

My original plan for this blog entry was to shamelessly promote GIS Day (November 16th)  – write something about this year’s t-shirt – and link it somehow to Geography Awareness Week. Fortunately, one chance occurrence has changed all that.

Picture this: a Sunday afternoon spent grading and helping students in my lab, and a workshop in the next room.  A chance encounter in the hallway.  “So, I see you teach in the Spatial Analysis Lab?  What is that?”, she asks quite innocently.  I explain.  “Oh (awkward pause) … well … what department would something like that fall under?”  I ignore the “something like that” part and answer as sweetly as is possible while drawing blood on my tongue because I know what’s coming next.  “But,” she continues … not meaning to be ignorant or offensive in any way, “what is it called?”  “GEOGRAPHY”,  I repeat .  “Well, I’ve already got a GPS.”  And with that, my new friend exits and my heart races like something from Rocky and Chariots of Fire combined and the conviction I have to educate people about my discipline is so deep I consider wrapping myself in maps and walking around campus as “Geography Girl”.  Thankfully, I’ve got two teenage daughters at home who know how to draw the line so that they aren’t forever banished from public life.

There is a great article written by Dr. Jerome Dobson of the American Geographical Society called “Bring Back Geography!”  In it he addresses both the idea of geographic ignorance (not knowing where places are) and ignorance of Geography – the discipline, which, by the way, is much more than knowing your state capitals, longest rivers, and highest mountain peaks.  “Geography Awareness Week” was created in 1987 by the National Geography Society (and others) to address this knowledge gap.  GIS Day is held on the Wednesday of Geography Awareness Week – its purpose – demonstrate the important contributions GIS is making to the discipline of Geography and to our world.

Now for the t-shirts and shameless promotion.  Each fall my Introduction to GIS students help the University of Richmond celebrate GIS Day by hosting an open house in our lab, inviting speakers to campus, baking (and eating) cakes, and wearing cool t-shirts.  Visitors can spend 6 minutes or 6 hours at this year’s event.  Our shirt design – “got gis?” has taken on special significance for me after a recent encounter with one of my students.  She and her partner were attempting the first part of a fairly complex three part analysis.  Their task – areal interpolation – involves disaggregating data from census tracts and then reaggregating it for hydrologic units.  Numerous frustrating failed-attempts and numerous questions answered with more questions (“Professor, why xyz?” … “Well student,” I answer wisely and patiently, “have you considered abc? Or perhaps the impact of d and h?” … I try to direct the student to find the answer instead of giving the answer outright) had nearly driven this pair to the breakpoint when suddenly she jumps out of her seat (and I’m not exaggerating – while parts of this blog entry may be fictional this is not one of those parts) and yells “GET SOME!” which in this context means “Oh yes, I am so satisfied with myself and really excited that I solved this problem that was very challenging” – perhaps a raunchy equivalent of yippee or yahoo.  That’s deep learning. So, for those who don’t “got gis?” I say only this: get some.

– Kim Klinker

from the director’s desk

September 12, 2011.  Today was a great day.  I arrived early to make sure all the computers were working and that I had enough handouts for my Human Geography students.  Ethan arrived early to make sure the GPS units were charging for an outing with my GIS class.  My students arrived and began a lesson created to help them learn about Territorial Morphology and Boundary Typology using GIS.  Working with a partner they navigated the world map looking for prorupt and perforated states  – “Does Vatican City count?  What about Azerbaijan?”  – it’s clear that many of them haven’t looked this closely at a world map in a long time.  “Where’s the Danube?”  “What’s next to Egypt?”  I love hearing the students talk to one another, and help one another.  I love the occasional “oh cool” that slips from their mouths.  But mostly what I’m so happy about is that none of the computers crashed.  Not one.  For the entire class period.  Success!

I think back to September 2010.  Students enter the Spatial Analysis Lab in the brand new Carole Weinstein International Center and begin what I tell them is going to be a very exciting lab.  They open the file, as instructed, and within 5 minutes computers start crashing.  When they don’t crash they run so slowly that instead of hearing the occasional “oh cool” I hear the occasional “oh damn”.  Students are rubbing their heads in frustration. “GIS”, they say, “stinks”.  Some students must exit completely, others begin texting while they wait for the computers to restart.  I’ve lost them.  I’d spent so much time creating these lessons – with the help of a Course Enhancement grant from the CTLT – only to face this.  The problem?  Data storage and retrieval.  Netfiles.  The solution: a Server.  It’s the only way to efficiently serve large amounts of data to a lab (or classroom) full of students simultaneously.  But, how to get there?  Money, cooperation from IT and IS and many other acronyms.  Training.  More training.  Loading data onto Server and rewriting all lessons for the new year and BAM!

Today, students completed their GIS Lesson without any technical difficulties.  No performance issues.  No slow drawing maps.  No crashing.  This is beyond great.  This is where I wanted to be.  Instead of being frustrated by the technology they were able to complete their lesson during class time.  They are gaining familiarity with concepts of human geography, spatial thinking, and rudimentary GIS skills.  In the first 3 weeks of school, our lab has been used by: 4 SAL interns, 4 Geography Faculty, 1 Biology Faculty, 1 Chemistry Faculty, 20 FYS – Biology students, 23 GIS students, 22 Human Geography students, 13 Mapping & Sustainability students, and 30+ Physical Geography students.  We’ve made maps for the Law School, the School of Continuing Studies and the Jepson School of Leadership Studies.  I’m so proud of how far this lab has come, and so excited about its future.  Yes, Vatican City counts.  The Danube – Europe.  And it’s Libya.  Libya is next to Egypt.

from the director’s desk¦

The middle of a Hurricane seems as good a time as any to begin putting together content for the new University of Richmond Spatial Analysis Blog. GIS has taken campus by storm. And, the winds of change are certainly in the air.  This year, the SAL – our nickname for the Spatial Analysis Lab – will reach out to many more students, faculty and staff than ever before.  Most of our new outreach is made possible by the acquisition of a SQL Database Server – a giant storage device housed deep in the recesses of the University’s data center below Millhiser.  Meridian, our geographically-named server, can store 5 TB of geospatial data, serve it to a wide variety of users, and keep rock-solid backups of the same. The growing pains of the last few years have (I sincerely hope) been worth it. The goal, in simple terms, was to give us the space for large amounts of geospatial data and to be able to share data with as many folks on campus (and eventually in the world) as possible. Getting to this point was not easy.  The School of Arts and Sciences committed significant financial resources to this new endeavor.  I’ve committed a significant portion of the last 6-8 months figuring out how to work it. Okay, so I’m still figuring out how to work it.  One of our former Lab Interns (now a UR Alumna) and I spent 6 solid weeks learning how to create databases on the new server, and create users and logins so that folks on campus could access the data without breaking it.  We struggled to learn the distinction between Permissions and Privileges (what!?!).  We employed a fascinating training technique – trial and error.  Lots of errors.  There were bad days when I thought “what have I done?” And good days when I proclaimed “look what I did!”  In the end, we’ve got over a hundred pages of technical documentation to help us implement our plan.  Over the next few weeks and months, the SAL will be making available many different kinds of geospatial data sets to the UR Community.  We will be co-hosting 3 PETE workshops for folks interested in learning more about GIS Technology. We will be planning our 4th Annual GIS Day celebration (Wednesday, November 16).  Here’s to a great year!