The American Association of Geographers (AAG) Annual Meeting is a chance once per year for our department’s students, faculty, and staff to present their research to peers and learn about what other universities all across the world are doing with geography. For many of our students, it is an eye opening experience to see the many different sub fields of geography all in one place. As one student remarked “wow, so being a geographer means you just get to study anything, because it’s all spatial!” That is the sort of feedback that makes these conferences worthwhile!
This year’s conference was hosted in Boston (last year was San Francisco, next year is New Orleans). From the University of Richmond we had 3 students, 2 faculty, and 1 staff member in attendance this year. I took the liberty of asking our students and faculty about their trip to AAG. Check out their work and answers below!
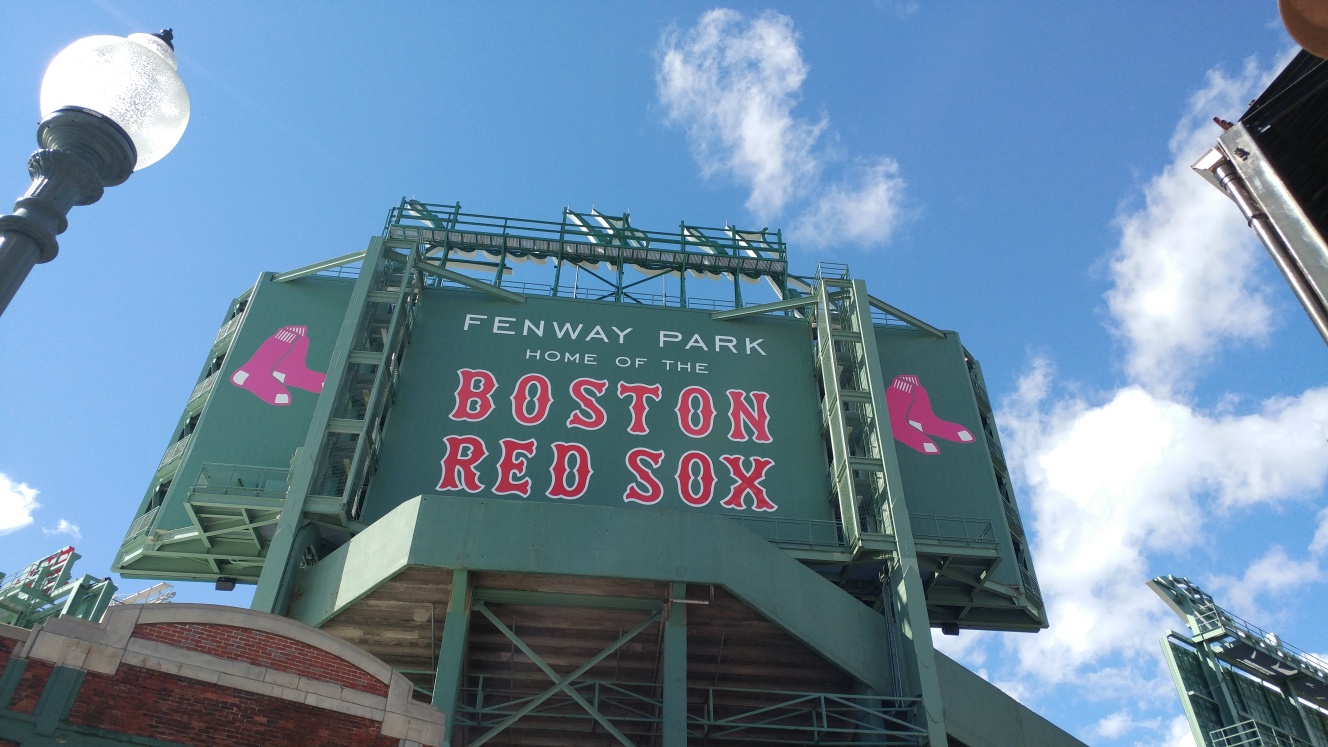
Fenway Park – Taken by Mary Finley-Brook

Left to Right: Jacob Salamy, Ethan Boroughs, Evelyn Jeong, and Taylor Holden
Ethan Boroughs
Q: What did you present?
A: At AAG I presented the project that I’ve been working on for the majority of the year, which has been building a spatial database for the gravestones that have been and are continuously being discovered in the East End Cemetery (a historically African American cemetery) in Richmond, VA.
Here’s my abstract:
The East End Cemetery in Richmond, Virginia is a historically African-American cemetery that has fallen into a state of neglect. The Biology Department at the University of Richmond is working with local volunteers to clean up the cemetery and record data on those buried there. Volunteers have collected GPS coordinates (using a GPS and the Collector for ArcGIS app) of the headstones at the cemetery, as well as collected personal attribute data from the gravestone inscriptions. Local volunteers working on the site submitted the data to Find A Grave, a website that helps people find their family members. Unfortunately, this site does not have options for spatial data, so volunteers also kept a separate spreadsheet in excel with the GPS coordinates. Once the Biology Department got involved, they approached members of the Geography Department to create a database with spatial elements in order for them to store their data about the cemetery in a cleaner, more systematic way. This project is a collaboration between the Geography and Biology Departments and CCE of Richmond to assist in the regeneration of the East End Cemetery. The data collection and review process has been essential to building a database that will feed an interactive and searchable map in the future. Like East End Cemetery, many African-American cemeteries have been forgotten and lost in undergrowth, but this project for East End Cemetery is part of a larger movement in order to reintegrate African-American cemeteries into our history, and to stop such loss from reoccurring.
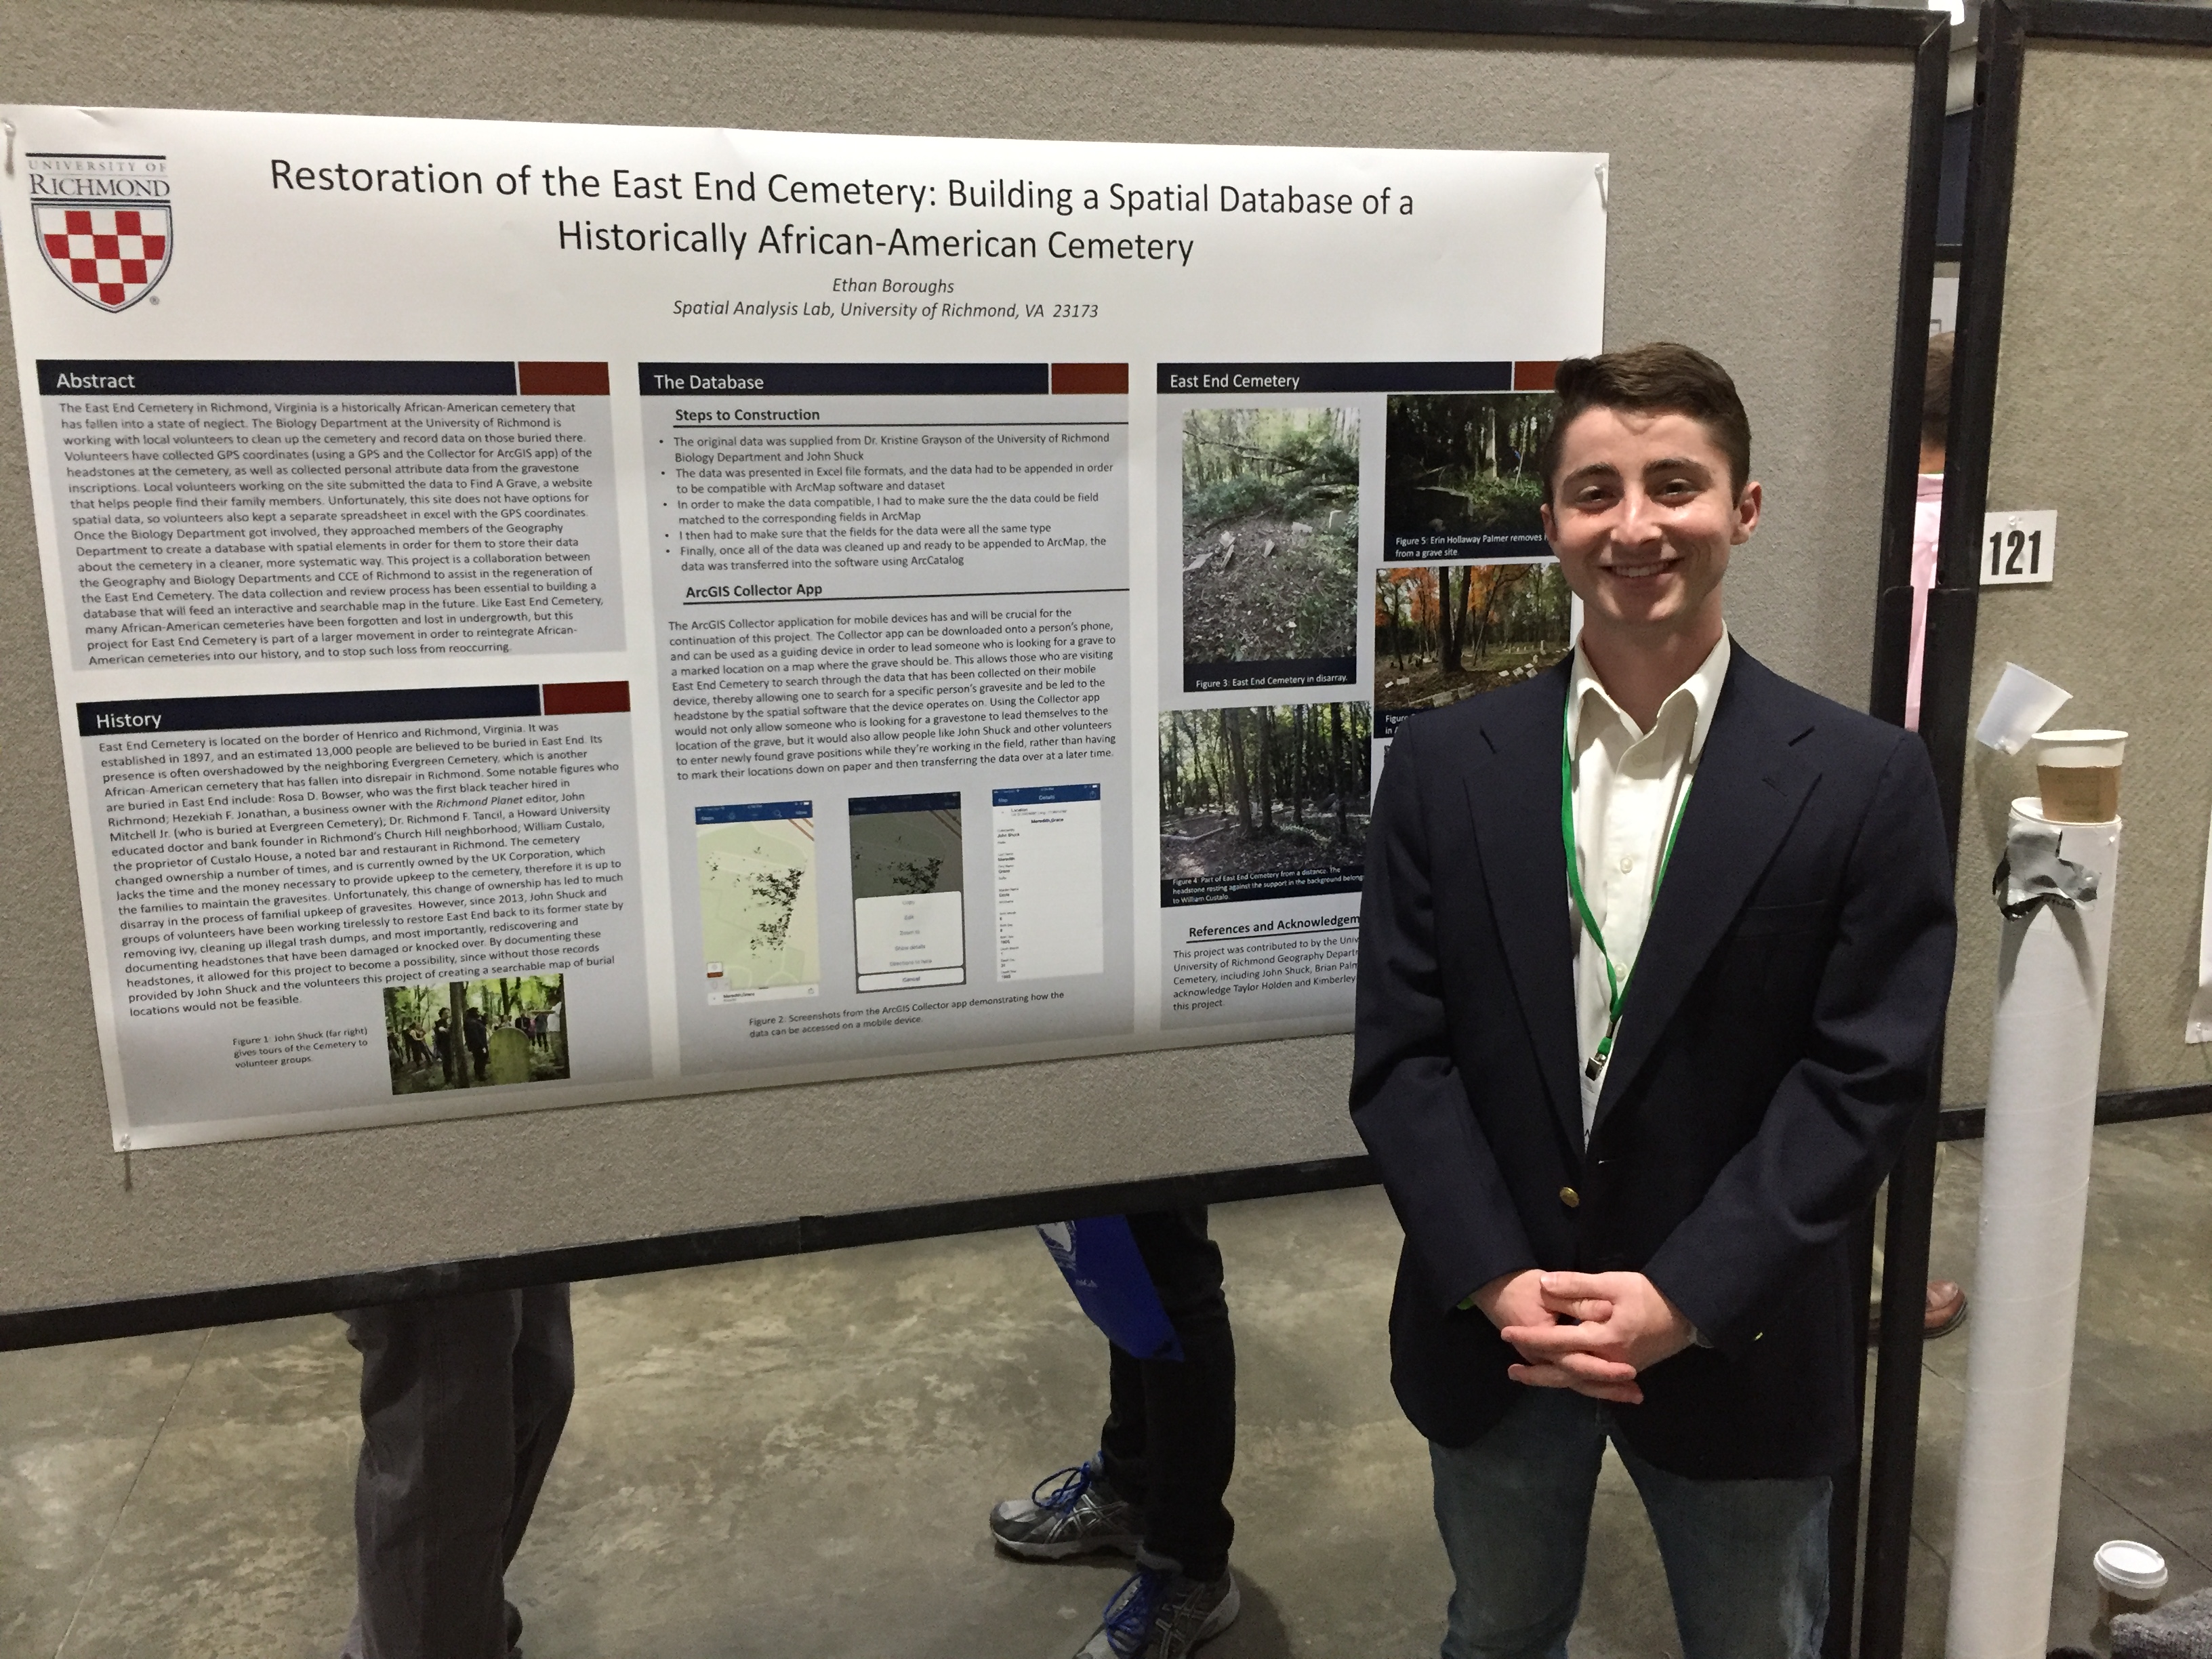
Ethan Boroughs with his poster
Q: What was the best thing you saw at AAG?
The most remarkable poster I saw at the conference was a poster that represented a project where a student used LIDAR data and an algorithm that was trained in order to recognize bumps underneath the surface of topsoil in order to locate unexploded bombs that were dropped in Europe during WWII.
Q: What was the best part of your trip to Boston outside the conference?
My favorite thing I did outside of the conference was touring around the city of Boston with no agenda, just kind of walking around the city, going in shops, seeing famous local landmarks, and eating at good restaurants.
Jacob Salamy and Evelyn Jeong
Q: What did you present?
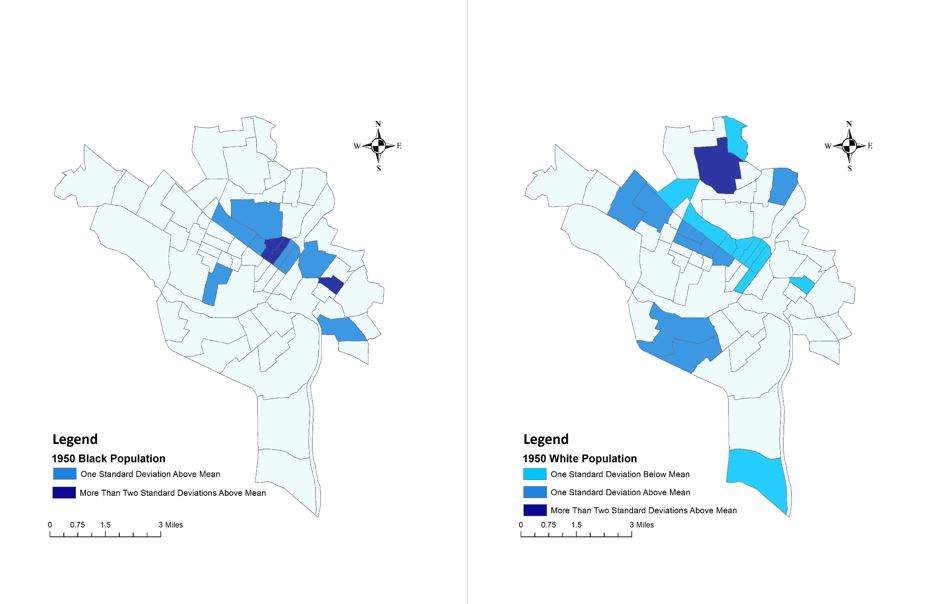
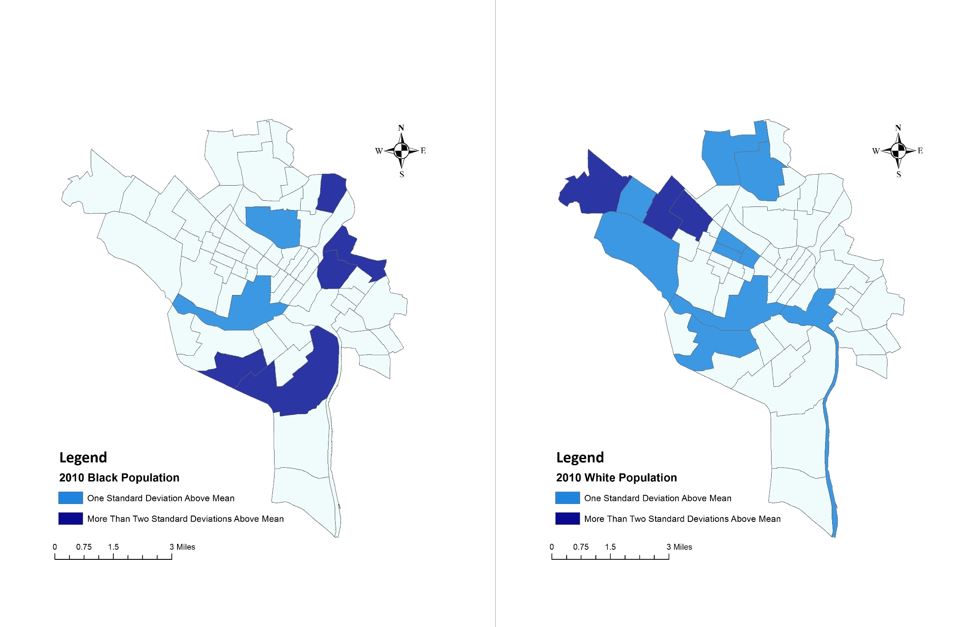
A: Our poster was called “Demographics Dynamics in Post-Annexation Richmond”. It focused on the work we and the Intro to GIS classed did around Dr. John Moeser’s book: The Politics of Annexation.
Here’s our abstract:
Published in 1983, Dr. John Moeser’s historical account Politics of Annexation: Oligarchic Power in a Southern City remains the most thorough and detailed resource for understanding the historical significance of Richmond’s annexation of approximately twenty square miles of Chesterfield County in 1970. With motivations rooted in racial dynamics generated by both the mass exodus of Richmond’s white population and the migration of African-Americans to America’s urban areas, the annexation was a power move by Richmond’s power elite to maintain the political status quo by incorporating an additional 44,000 white residents of Chesterfield into Richmond’s city limits. This had the effect of diluting Richmond’s black population’s vote enough to ensure a white majority for Richmond’s 1970 councilmanic elections. The annexation was hotly contested all the way up to the Supreme Court, which ultimately ruled that it was racially motivated. However, the annexation stood after Richmond reached a compromise whereby the city would hold local elections using a ward system designed to counterbalance the massive influx of white residents brought about by the annexation. Using census data for the years 1950-2010, we analyze the immediate impact that this annexation had on Richmond’s demographics overall as well as its long-term effects on Richmond’s individual neighborhoods. To complete this statistical analysis, we use dasymetric interpolation to generate equivalent land areas for comparison. Broadly, we hope this research will provide a clear and compelling portrait of Richmond past and present.
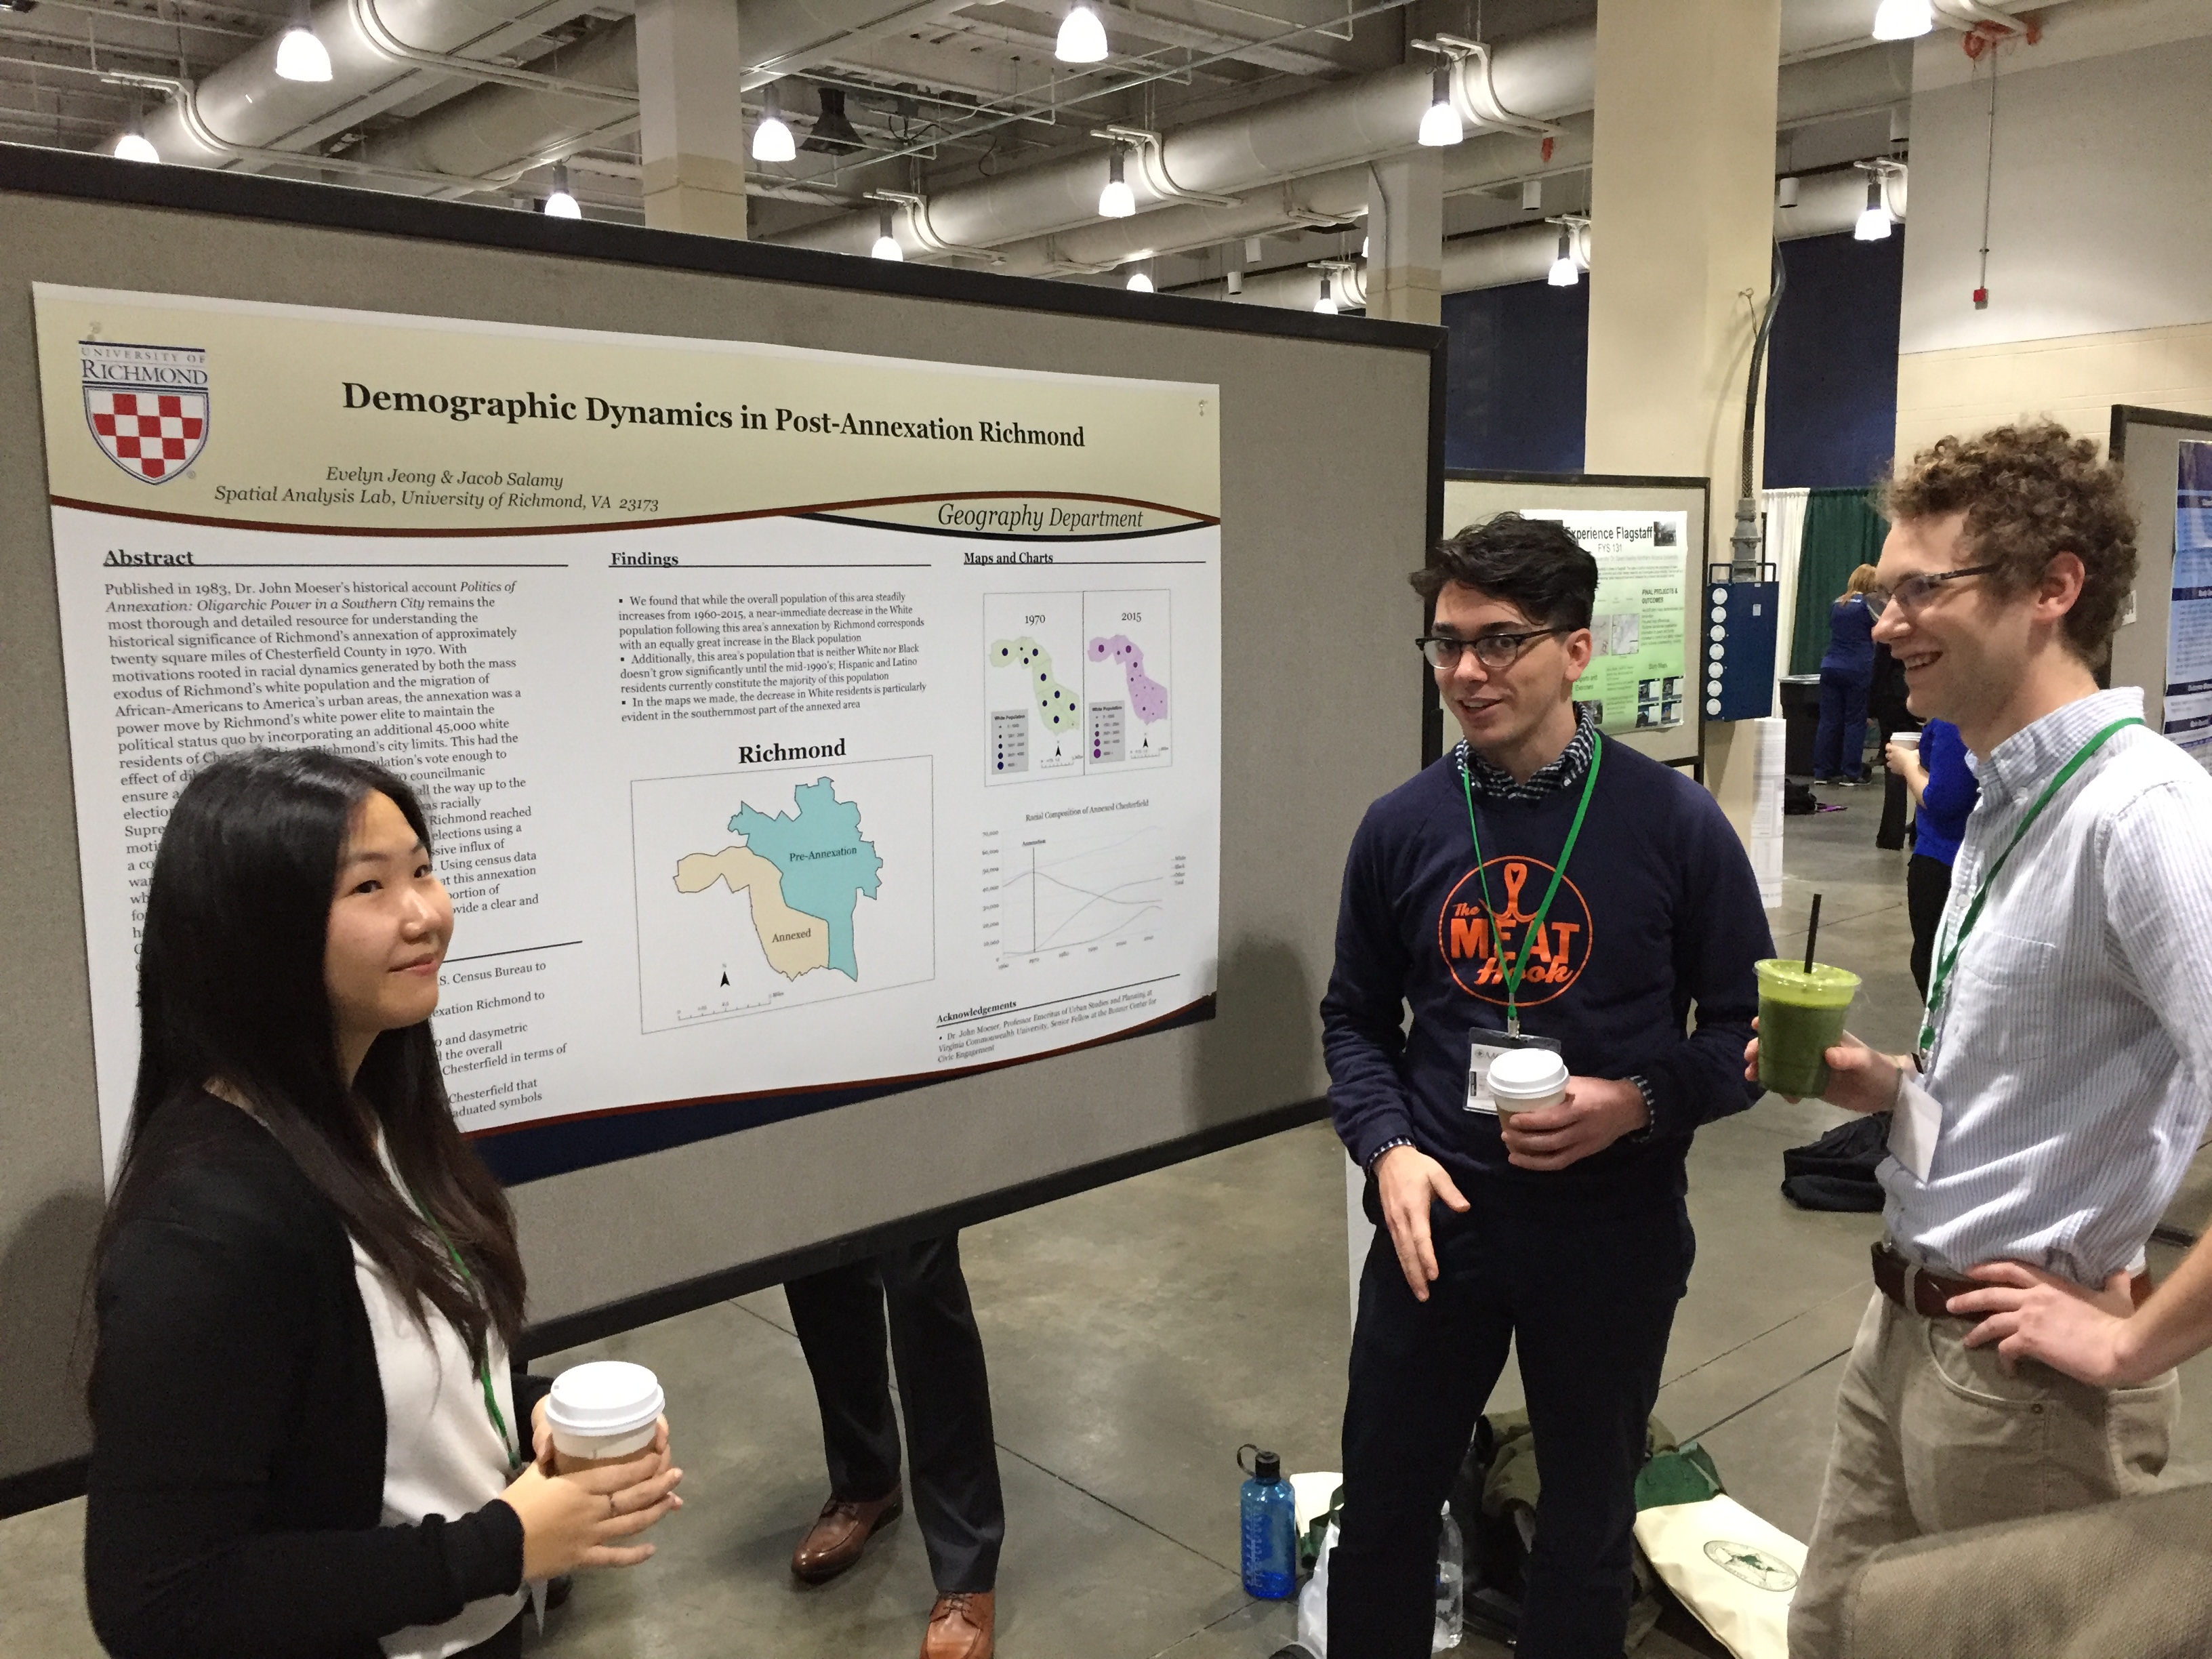
Jacob and Evelyn describe their poster to a captivated audience member
Q: What was the best thing you saw at AAG?
A: (Jacob) The best poster I saw was on estimating the population characteristics of non-reporting individuals from Japan’s census.
A: (Evelyn) I also really liked the poster that talked about the non-reported population in Japanese Census Data. There was a huge discrepancy between the number of non-reported for age, which was only approximately 0.9%, and education level, which was up to 20%. The poster mentioned the possible reasons why people would report age but education, as well as how to solve the marginal error when presenting statistics. I thought about the non-reported on the U.S. Census Bureau and how to solve the problem of the marginal errors in the statistical analysis.
Q: What was the best part of your trip to Boston outside the conference?
A: (Jacob) Ethan and I accidentally snuck into an admitted students day at Harvard’s graduate school of design and got to tour the whole school!
A: (Evelyn) I visited the Freedom Trail and the Gas Chambers that informed about Holocaust and the experience people had. The Gas Chamber had anecdotes of survivors and journals that reminded me of the history. It reminded me of the phrase “history repeats itself”, given the domestic and international political situations all over the world. I also loved the Boston Public Library Map Center.


Taylor Holden
Q: What did you present?
A: I presented in an illustrated paper session on the topic of “Demographics of Annexation: Using History and Politics to Teach GIS”. It focuses on how we used Dr. John Moeser’s book about the history of annexation in Richmond as well as his current research in our GIS courses this semester.
Here’s my abstract:
The City of Richmond, Virginia has a long and complex legacy of racial and economic segregation, one that persists to this day. Scholars from various disciplines have studied Richmond’s political, structural, and demographic history to tell the story of the former Capital of the Confederacy. Geographic Information Systems (GIS) can be used to provide both context and a platform for exploring Richmond’s history. Students in several GIS courses at the University of Richmond used Census and American Communities Survey data from 1950-2010 to explore the 1970 annexation of Chesterfield County by the City of Richmond. Students in introductory courses learned analysis methods including areal interpolation and dasymetric mapping to solve the Modifiable Area Unit Problem (MAUP). They also explored cartographic principles like the use of color, classification, and scale by examining the annexation and subsequent changes to the spatial distribution of race within the city. Students in advanced courses then built on these lessons through geostatsitics and advanced visualization techniques. Throughout this process students used ArcGIS Online and Carto to share their research with the public and bring Dr. John Moeser’s 1982 book, The Politics of Annexation: Oligarchic Power in a Southern City, to a modern audience accustom to digital information and the exploration of data.
Q: What was the best thing you saw at AAG?
A: My favorite part was getting to see Noam Chomsky talk as one of the main speakers. He was interviewed by the head of AAG. The interview itself was a bit lacking in terms of good questions, but getting to see Dr. Chomsky start rolling on a topic and really dig into the history, language, power dynamics, perceptions, and every aspect of something was fascinating. Although I’ve read his writing before, getting to see him speak made me really understand why AAG had no problem introducing him as “the most important intellectual of our times”.
I love that AAG gives an award to a non-geographer each year and has them speak at the conference. It illustrates how geography touches all disciplines in some way.

Q: What was the best part of your trip to Boston outside of the conference?
A: My boyfriend, Josh, tagged along on this trip to check out Boston and the surrounding areas. We went with a friend to Salem one day and did the witch tour and saw all the kitschy museums and shops. I highly recommend it to anyone in the Boston area. We also had lots of incredible meals in Cambridge and Somerville (shout out to Sarma, the best mediteranean/Middle Eastern food I’ve ever had).
Professor David Salisbury
Q: What did you present?
A: I presented my paper: The Religion of Road Building: A Case Study of the Alto Purus Region of Peru. The co-author was UR/ San Francisco de Quito exchange student Melissa Velasco.
Here’s our abstract:
Road building in the Amazon continues to develop at a rapid rate despite a growing understanding of the socio-environmental impacts resulting from transportation infrastructure expansion in tropical rainforests. In August of 2016 congressional representatives in Lima again proposed a bill to create a road connecting the remote Amazonian Purús region with Peru’s Interoceanic Highway. The 270 km proposed road would cross a national park, a communal reserve, an Indigenous territory, forestry concessions, and a reserve for Indigenous peoples in voluntary isolation and initial contact. Currently, the only way to travel to the Purús from Peru is by air given the 4,000 inhabitants of the town of Puerto Esperanza and 22 neighboring titled Indigenous Territories are surrounded by Peru’s largest protected area. Pro-road and anti-road Purús residents frequently clash over the benefits and drawbacks of the proposed road with each side backed by interested parties such as loggers and environmentalists. This research combines GIS analysis of the proposed road’s path and potential impacts, survey research of resident attitudes towards the road, and textual analysis of publications and recordings referring to the road. Results indicate how the argument over the road has become combined not only with discussions about livelihood and land use choices, but also spiritual salvation, ecological imperialism, and the exploitation of Indigenous peoples.
Q: What was the best thing you saw at AAG?
A: The best paper I saw was The necessity of optimism about climate change mitigation and adaptation in the tri-national MAP Region of southwestern Amazonia presented by Dr. Foster Brown from the Woods Hole Research Center and the Federal University of Acre. Dr. Foster Brown talked about strategies for slaying the psychological dragons of inaction that prevent humans from taking action to address climate change. I’ve already incorporated parts of this talk into two International Studies classes.
Q: What was the best part of your trip to Boston outside of the conference?
A: Staying with and spending time with four aunts and uncles. Sharing a session with my 65 year young uncle Dr. Foster Brown as three of his siblings sat in the audience.
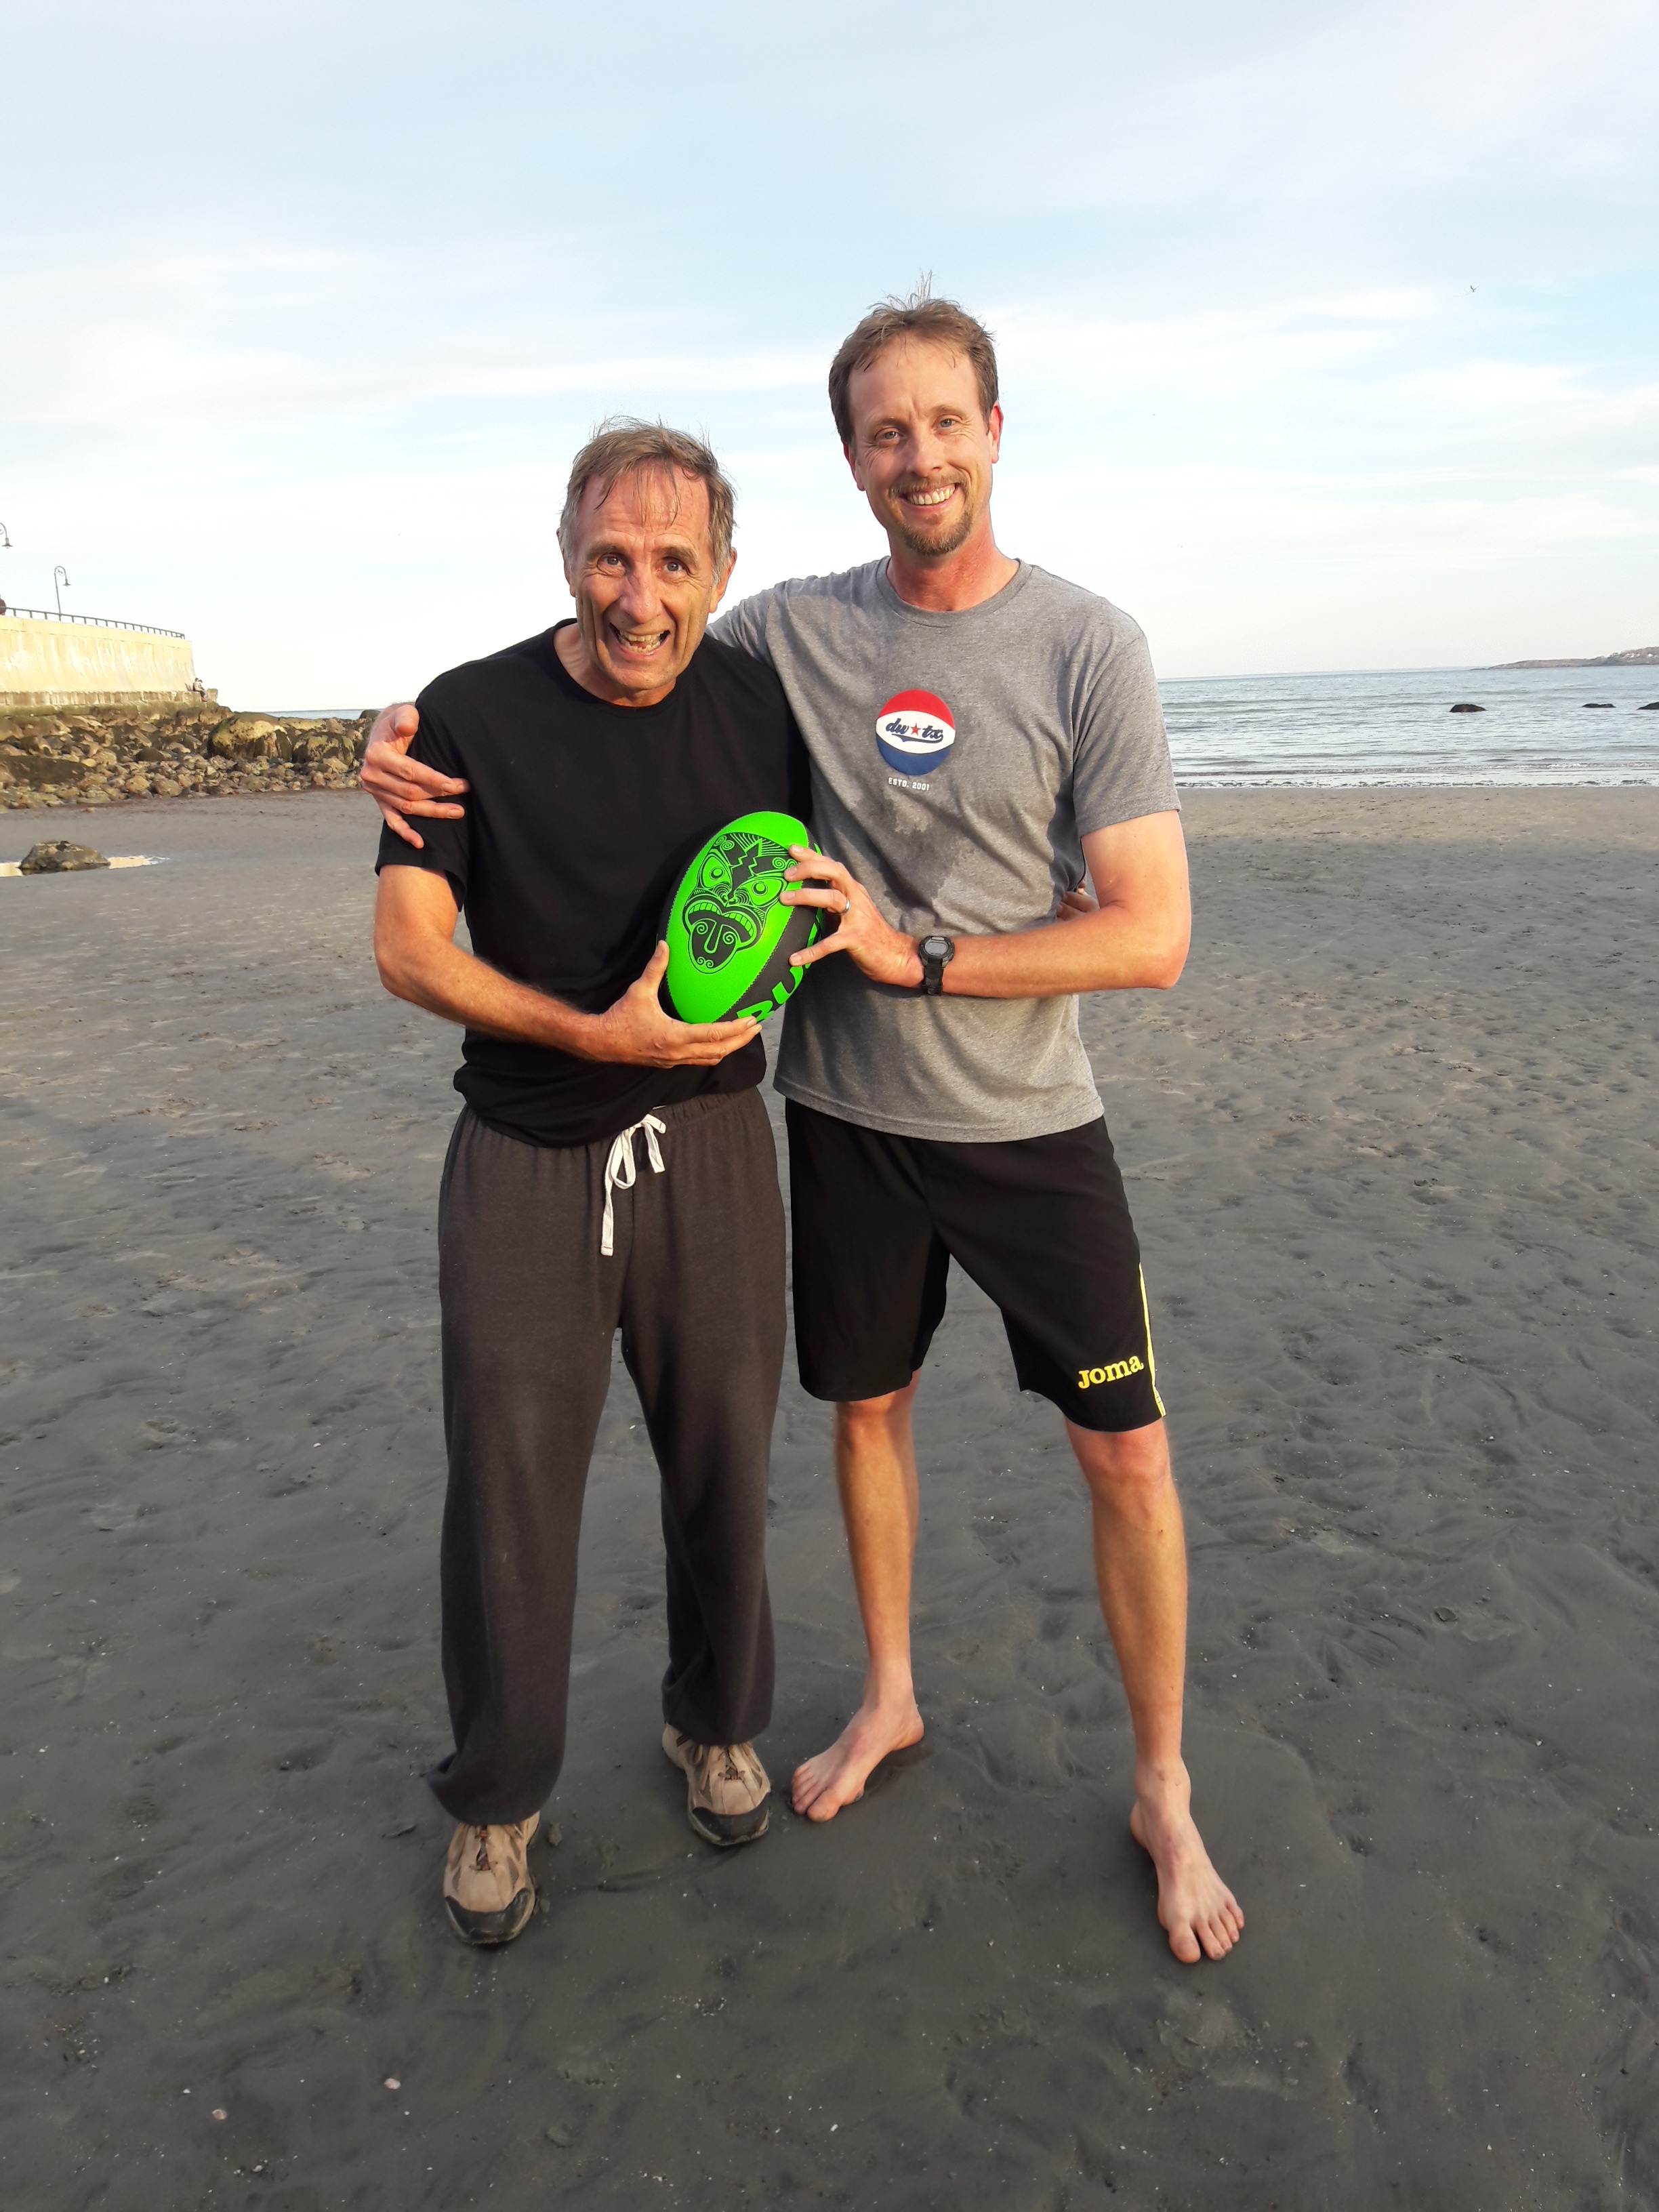
Dr. David Salisbury with Dr. Foster Brown, his uncle
Professor Mary Finley-Brook
Q: What did you present?
A: I presented my paper: Racial Violence and Deadly Energy in the Americas.
Here is the abstract:
New energy infrastructure and energy transitions commonly lead to contested socioecological spaces and futures. Violent oppression flourishes in Latin America’s expanding fossil fuel and renewable energy systems with deadly force sometimes used to facilitate energy development. Homicide often follows social opposition and is utilized as a cruel tool to eliminate or intimidate land defenders, environmental protestors, and marginalized populations, particularly Afro-descendant and Indigenous Peoples. While direct physical violence towards energy project opponents and populations impacted by energy infrastructure is usually more subdued in the United States and Canada, structural violence built upon racism and economic inequality is frequently apparent in socioecologically harmful energy initiatives across the Western hemisphere, whether in the creation of new projects or in the maintenance of detrimental facilities. This paper provides comparative analysis of petroleum, coal, natural gas, hydropower, and biofuel case studies in North, Central, and South America to (1) identify energy’s pivotal role in social relations and spatial interactions in both industrialized and peripheral economies; (2) expose patterns and processes of energy-related violence; (3) advance understanding of how low-carbon rhetoric is used to justify socially and racially oppressive energy infrastructure; and (4) demonstrate how the term ‘deadly energy’ corresponds to more than situations of homicide as risks with potentially fatal consequences (e.g., explosions, accidents and spills, public health consequences from waste dumping and toxic pollution, land grabbing, competition with subsistence livelihoods, etc.) are experienced in marginalized spaces and by people of color.
Q: What was the best part of your trip to Boston outside of the conference?
Wind Turbines