Category Archives: Outreach

Week 1 of Crash Course: Kenyan Culture

June 7, 2018

By Lauren Scheffey ’20

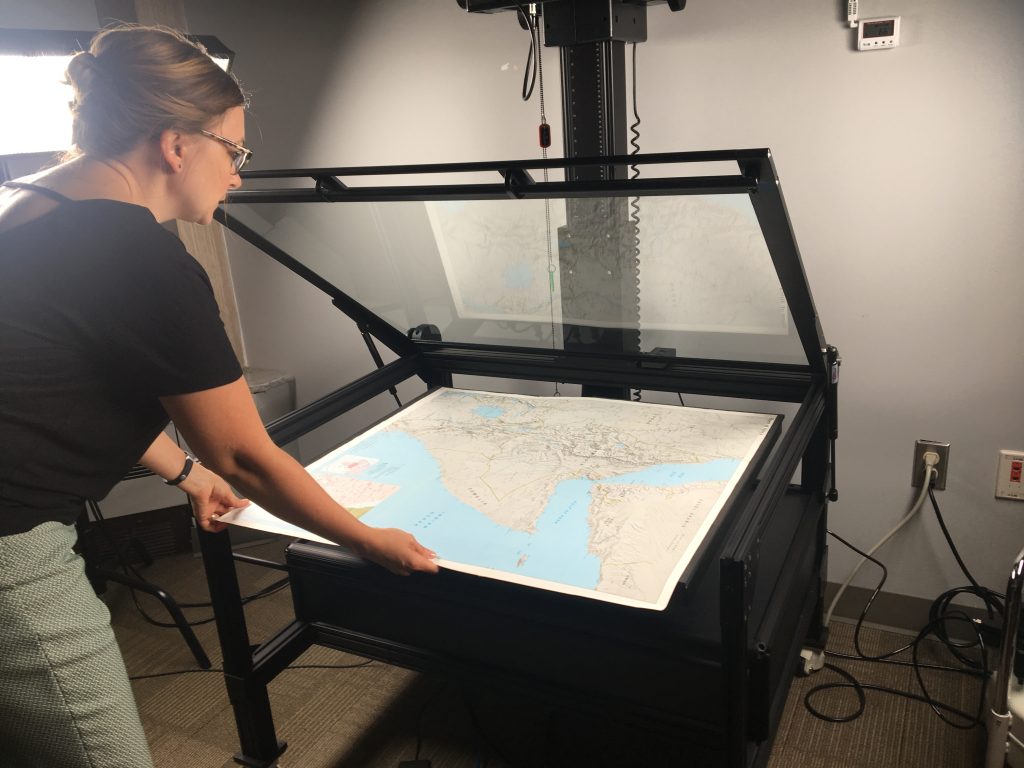
Today we met Kimberly Wolfe in the Digital Scholarship Lab in the library to learn how to convert physical maps to a digital form. We used the university’s high-tech, super-expensive camera and a program Kimberly called “photoshop on steroids” to take a photo of the map and adjust the focus, exposure, white balance, and alignment. Our end result was a high resolution.jpg nearly identical to the physical map, and ready to be imported to ArcMap and georeferenced. The National Lands Commission has already scanned the maps of the settlements, so we will not be involved in that aspect, rather we will be cataloging, georeferencing, and digitizing the scanned maps. However, seeing how to scan maps and convert them to digital forms helps us understand the process from start to finish, rather than simply the components we will be working on directly.

We been dividing our time between technical, GIS-related prep/training and ensuring we’re prepared with things such as medications, clothing, and TSA-approval, plastic-free travel bags. Yesterday Taylor showed some of the data he has been downloading from OpenStreetMap that will be useful to us when we are digitizing the polygons of the settlements. We created a template map documents including roads, waterways, and counties in Kenya, as well as a 50k and 10k grid. Each settlement map has an index number, which we will use to locate the settlement within our grid system. Once we have the location, we will be able to see the roads/waterways that constitute the settlement’s borders and use the corresponding features of those roads/waterways from the OpenStreetMap data to digitize a polygon of the settlement.

We have also been reading books and articles about Kenyan culture and corporate etiquette and practicing some simple Swahili phrases, such as “habari” meaning “hello,” and “asante” meaning “thank you.” We are trying to read some of the most popular/important books in Kenya culture, and I am currently reading “Wrestling with the Devil,” Ngũgĩ wa Thiong’o’s memoir recounting the time he spent imprisoned by the Kenyatta regime. From 1977-1978, Ngũgĩ wa Thiong’o was detained in Kamiti Maximum Security Prison, under 24-hour surveillance. It is here in prison, however, that he writes his most famous novel, “Devil on a Cross,” on prison-issued toilet paper.

While it is impossible to learn everything about a culture in just two weeks, it has been fun for us to immerse ourselves in Kenyan history, language, politics, and customs as we try to learn as much as we can in preparation for our trip. We are finishing up our training and some last-minute packing and are excited to be in Nairobi soon and start working at the NLC!
Richmond Math Science Investigators (MSI) in the SAL

Post by Marissa Parker ’16

This summer, the SAL is hosting four rising 10th grade students from Richmond Public Schools in the Richmond Math Science Investigators (MSI) program. The goal of MSI is to increase the number of students pursuing a career in science, technology, engineering, and mathematics (STEM) fields. The students are interested in the sciences and hope to pursue STEM fields in college and beyond. The MSI Program spans five weeks.

Our four students knew little about geography when they entered the program, but now are learning to connect their interests in natural/life sciences and engineering to geography and GIS. In the SAL, the students are learning about earth systems and physical geography relating to climate change, how to create basic maps in ArcMap, what GIS is and how to apply it, and how to conduct fieldwork while contributing to our campus tree inventory.

Take a peek at our students’ reflections on the first week…

MSI_photo1

Shanaya:

During the summer a group of high school students and I engage in a 5 week program with mentors from the University of Richmond. The program starts on Monday and ends on the Thursday of that particular week. This week was very interesting learning about maps and the concept of GIS. We evaluated different maps that relate to GIS and how you can input different data.

Jonathan:

I learned a lot over the past few days. Each day in the afternoon we watched these really exciting and fun videos on different countries that explained a lot of the country’s characteristics. We talked about GPS and used one to locate different locations on campus. We looked at maps and talked about the different aspects of them and finding other aspects dealing with maps. Today we looked at GIS which is a system used to view maps and help us as people make decisions for our everyday life. We used a program on the computer and experimented with it. My favorite part was everything I did because it served a purpose in my learning and knowledge gaining and it was very fun.

Markee:

I learned that the Costa Rica flag has red, white, and blue colors. Working in ArcMap is fun and simple to use. Many people use it today to get around or just find different locations of where they want to travel.

Stephon:

I have learned several things this week. I learned about cartographers, projections, and scales. I now know about various types of projections such as the Mercator and Peters map projections. The Mercator map projection is the typical map that we use today. However, it isn’t proportionate and makes northern continents such as North America, Europe, and Asia appear more important than southern ones like South America, Africa, and Australia. On the contrary, the Peters projection emphasizes southern continents and makes them seem more important. I also learned more about how cartographers use GIS (Geographical Information Systems). Lastly, I learned about how scales show ratios of distances in the real world.

Stay tuned for more reflections from our wonderful MSI students!!!