Category Archives: SAL

Geo-Referencing the Jepson Quad

Post by Shaquille Christmas ’15

This post was from February 2016

This week students in the GEOG 280 course “Maps and Geovisualization” got a taste of how challenging it was for early Cartographers to survey an area, and draw what they saw—with a high level of accuracy. Students went into the Jepson quad and created a sketch of what they saw and tried to match their drawing to a true scale.

Next, their drawings were scanned and imported into ArcGIS; a tool I am sure early Cartographers would be proud of.

3

Using the georeferencing tool, students then tried to match the different points on their map to the actual lay of the land as closely as possible. Many students had done such a good job that their hand drawn maps were georeferenced within a few feet to the actual distance on the ground which was an amazing site to see. Overall, it was a fun and eye opening exercise in which students gained a greater appreciation for the work of early Cartographers.

4


IMG_0098

Note from Taylor:

From a teaching perspective, I found this lesson to be highly effective not only at teaching students how to georeference maps, but also how to understand scale. They each had the opportunity to create their own scale for their hand drawn map. Each student could take their own approach to developing their scale, either by walking out the paces, estimating with their eyes, laying down on the ground to use their height, or even bringing a tape measure (which we didn’t allow them to use, just to make it a little more challenging). However, they realized that with a tape measure they could have gotten even more accurate with their scales, although they didn’t need it as Shaquille mentioned! This was a fun lab to do with students who haven’t taken GIS or other geography courses before, and we will likely incorporate it into future georeferencing and scale lessons.


GIS in Action: DC2RVA Field Trip

Post by Shaquille Christmas ’16

A couple weeks ago we visited the Richmond office of  Henningson, Durham, and Richardson, Inc (HDR), which is an architectural, engineering and consulting firm based in Omaha, Nebraska. UR alum and former SAL researcher extraordinaire Bridget Ward recently started working there as a GIS consultant in the transportation division. Bridget and her colleagues spoke to us about the DC to Richmond South East High Speed Rail project they are spearheading the planning for. They detailed the different ways in which HDR uses Geographic Information Systems (GIS) to support not only the DC to Richmond rail project, but also many of their other projects. These uses include preparing bids for contracts, performing analysis for various departments before and during construction, and especially communicating with the public. Below is a map they created showing the proposed rail route.

DC to Richmond (2)

One of the other interesting projects they talked about was an expansion of Route 460 that was delayed and ultimately drastically changed due to another contractor using inaccurate data to make decisions about impacts on wetland health. Since we have worked with wetland data on several projects over the summer it was cool to see how important accurate and detailed analysis is, and how detrimental careless errors can be!

20150710_131235

Overall, our time spent at HDR was both invaluable and inspiring. Bridget and her team gave us several homework projects of cool tool and methods we should learn to prepare for working in a professional and team environment. It is my hope that other students are getting experiences such as this, and are receiving advice on how to best put their GIS skills to use as they consider potential career paths.

20150710_125058

Streetview for Trails: Online Mapping with Terrain360

Post by Jared Goldbach Ehmer ’17

This week in the SAL, we continued working with Ryan Abrahamsen from Terrain360.  Last week we modified visual hierarchies on basemaps to make them more aesthetically pleasing.  To do this, we used the open source program called Mapbox. Mapbox required us to code in CSS, something none of us had ever actually done.  While most of us had coded in some regard in the past, it was either a new language to learn or a new experience altogether.  The basemaps we created and visually modified are used to house the trails and panoramas mapping them.

Hollywood_Rapid

View from Hollwood Rapids on part of Terrain360’s online map of the James River. Found here: http://t360.it/QN0010

Mud_Creek_Trail

Example of what a trail looks like in Terrain360. This is the Mud Creek Trail near Ancarrow’s Landing. Found here: http://t360.it/QN0010/0/0/1

This week, we were given the opportunity to actually go out and take the pictures that will go on basemaps like the ones we created.  Using a Canon Rebel T3i with a wide-angle lens on a carbon fiber tripod with a 60 degree rotatable head provided by Terrain360, we were able to take wonderful and accurate panoramas.  While in the field, a series of 6 portrait-aspect pictures were taken that overlapped for about a third of their girth due to the wide-angle lens.  A GPS (Global Positioning System) was brought along with the camera to record where the photos were taken so the photos could then be linked to geographic coordinates.  Once back in the lab, these pictures could be stitched together to form a seamless panorama and placed on a map with the attached GPS coordinates.

Ryan walked us through a few camera basics to get us all up to speed with a basic level of camera aptitude.  Each panorama, or series of six shots, was unique and everything had to be adjusted for that particular location.  For each series of shots, we adjusted white balance, shutter speed, and focal point.  The white balance was adjusted for sunny, cloudy, shady, fluorescent, or incandescent lighting.  For most of our shots, we switched between the first three outdoor Kelvin levels.  Shutter speed was probably the main variable that was changed for each shot, for it may still be sunny out, but the level of light and exposure that we wanted to capture would have been different.  Shutter speed is measured in seconds or fractions of seconds, our particular camera having a range of 30 seconds to one four-thousandth of a second.

RunningTrails

There are three running trails on the campus of the University of Richmond that we photographed, the blue, the gold, and the red.  These trails can be seen in the map above.  In addition to the three running trails on campus, we also photographed the Gambles-Mill trail and the route you can take from it to the Huguenot Flatwater Park. The trail starts by running along the Country Club of Virginia golf course, eventually meeting River Road at the River Road Shopping Center.

We crossed River Road over to Huguenot Road and followed it down all the way across the Huguenot Memorial Bridge. Then we followed the cloverleaf exit and took the left onto Riverside Drive and then a quick right onto Southampton Road to arrive at Huguenot Flatwater Park.  Because each panorama needed to be about 20-30 feet apart and customized accordingly, even a simple walk around half the lake could take about two and a half hours to capture fully.

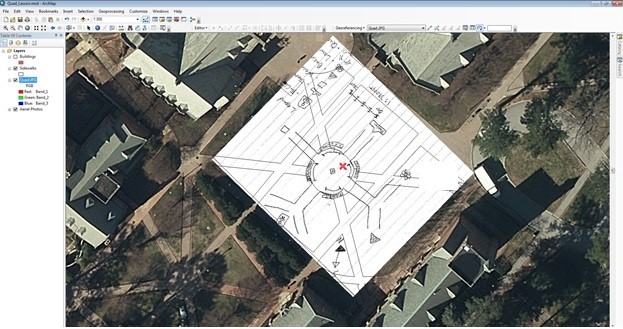
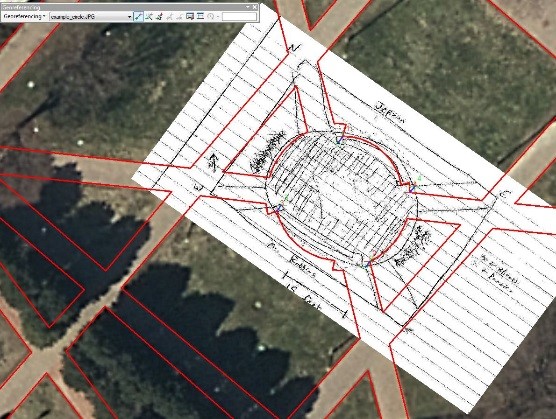
In the coming week, we will be both stitching the photos together to form the actual panoramas and placing them on the basemaps with the geographic coordinates. We have tried a few so far and are still working out kinks with the process. However, the “mess ups” are pretty cool to look at! To see our work and all the other places that Terrain360 has covered, go to http://www.terrain360.com/.

FullUR_0043 (2)

Attempt at stitching a panorama of the bridge on the Blue Trail over the lake

This project was interesting to us not only because it helps an organization doing cool work, but the skills we are learning are very applicable to other projects we might do. In terms of technological application, this project exhibits directly correlation to utilization in both Virtual Tours of Campus as well as a Virtual Tour Showing Students the way to Huguenot Flatwater Park.  The virtual tour of campus would be beneficial for prospective students and especially for students that are unable to travel to visit the campus in person.  Having a photographed route to Huguenot Flatwater could also encourage more students to make the trip down to Huguenot Flatwater Park.

Winter Workshop Series

Wed., January 21, 10:30-11:30 am
Web Mapping with CartoDB
Tuesday, January 27, 10:30-11:30 am
ESRI Maps for Microsoft Office
Thursday, February 5, 3:00-4:00 pm
“How to Lie with Maps”
Wed., February 18, 3:00-4:00 pm
Mapping in ArcGIS Desktop
Tuesday, March 3, 10:30-11:30 am
Interpolating U.S. Census Data

Summer in the SAL 2014

While not hard at work, we may take a break by completing some geography-themed jigsaw puzzles!

School may be out for the summer, but that doesn’t mean the SAL has been asleep! Instead, we have remained a busy, active place, with many students working on environmental and geospatial research projects. Here’s a quick update of what’s been happening (so far) this summer in the SAL.

  • Hunterr P. ’15, the second University of Richmond student to take advantage of the 3-2 program we have with the Nicholas School of the Environment at Duke University (he will start pursuing his Master of Forestry this fall but will receive his undergraduate degree from UR in the Spring of 2015), continues to work on a project with the Virginia Department of Conservation and Recreation (DCR). Using a healthy combination of ENVI and ArcGIS, Hunterr has been working to analyze and classify LANDSAT imagery covering the state of Virginia. His work will help the DCR create a statewide development vulnerability model—which natural areas in the state are most at risk of development?
  • Heather C. ’16 and Meghan M. of the College of William and Mary have been helping Dr. Todd Lookingbill prepare a Natural Resources Condition Assessment (NRCA) report for the Booker T. Washington National Monument, located near Roanoke. The NRCA reports, which have been or will be written for many of the units of the National Park Service, analyze the current condition of natural resources in those parks and try to elucidate long-term trends about their resources. In particular, the reports use lots of maps to communicate their results. Dr. Lookingbill has worked with students on prior NRCA reports, including one for Shenandoah National Park; while Booker T. Washington is a much smaller park, there is still a great amount of work involved in creating the report.
  • Will H. ’15 is working with Dr. Mary Finley-Brook on her continued efforts toward making the University of Richmond campus a more sustainable, environmentally-friendly place. Will has taken various trips to other universities and conferences to learn about their sustainability efforts and is researching how to implement some of those ideas here. He’s even making some maps to document his findings!

In addition to all this student research, we’ve had a few other notable events. SAL Director Kim Klinker just got back from leading her annual summer study abroad trip to Australia; she has created a storymap showing where the trip went, complete with student reflections about each day’s activities. The University’s Information Services department will be updating the SAL computers later in the summer, updating our software to ArcGIS 10.2 so that our students stay on the cutting edge of GIS technology. Kim and Andrew will be traveling to the Esri Education GIS Conference in San Diego and will present a talk about our campus mapping efforts; they will also get to attend a few days of the big Esri International User Conference, following the Education Conference. And of course, the “World Famous” Spatial Analysis Lab seeks to again dominate the Gottwald Games, a series of lighthearted games held by the science departments labs, to be held next week. Be on the lookout for our custom t-shirts, and start brushing up on your geography skills—we’re hosting a game this year too!

And finally, our current GIS Technician, Andrew Pericak, will be stepping down at the end of this month so that he can began his Master’s study in the fall. Andrew will also be attending the Nicholas School of the Environment at Duke University, where he will pursue a Masters of Environmental Management. But the SAL will not be devoid of a Technician! The Department of Geography and the Environment has hired a new Technician, Chris Brown (as Kim says, No, not that Chris Brown,) who will be starting July 1. Chris brings lots of great technical and analytic GIS experience to the SAL, so hopefully the transition from one Technician to the other will go smoothly.

We here in the SAL are excited for all our exciting summer projects and activities. Yet sooner than we can imagine, the Class of 2018 will be arriving on campus. We look forward to greeting them in August and introducing them to the world of GIS!

Mapping toxic sites in Virginia with the UR Law School

Sachs reportThe University of Richmond comprises five schools serving both undergraduate and graduate students. The School of Arts & Sciences houses a majority of the undergraduate student body, but the School of Law is where most of the University’s full-time graduate students study. While the Spatial Analysis Lab falls under the purview School of Arts & Sciences, we are excited when we get to help some of the University’s other schools; we recently had such an opportunity when we got to assist the School of Law.

Law Professor and Director of the Robert R. Merhige Jr. Center for Environmental Studies Noah Sachs, alongside third-year law student Ryan Murphy, have released a report titled A Strategy to Protect Virginians from Toxic Chemicals, which is freely available at the preceding link. The report, which proclaims itself as “the first comprehensive examination of the sources of toxic releases in Virginia and the potential exposure of Virginians to harmful chemicals,” calls for increased attention regarding toxic chemicals in the environment because of their potential to lead to health problems and recommends how the Commonwealth can start to limit toxic exposures.

While the authors worded the report in common English, the release of toxic chemicals to the environment may not be a topic with which everybody has a lot of familiarity. That’s where the Spatial Analysis Lab stepped in, creating some simple-to-understand maps that showed the extent of sites containing toxic substances throughout Virginia. You can find these maps in the report, but we’ve included them in this post as well.


This first map looks at Superfund sites in Virginia. Superfund is the EPA’s program to clean up toxic waste sites; the NPL, or National Priorities List, is essentially a big list of these sites, so sites that have been removed may have already been sufficiently cleaned up.

The next map shows any facility in Virginia storing over one million pounds of toxic substances in 2011.

And this final map looks at Resource Conservation and Recovery Act (RCRA) corrective action sites in Virginia. RCRA is a law designed to regulate the disposal of toxic wastes. Click here to access the EPA’s interactive map.

The Spatial Analysis Lab is glad to offer assistance to Professor Sachs on this project. We look forward to continuing helping the Law School, and indeed the University of Richmond’s four other academic schools, in upcoming semesters!