
Here in the Pollock lab, we utilize a variety of techniques to learn and collect data on the characteristics and functions of proteins and molecules. Some of which include ‘homebrew’ assays that were developed by previous members of the Pollock Lab. The assay I use most frequently is fluorescence polarization. My lab mates utilize DNA damage assays and other forms of protein binding assays for their projects. One reason I love having the opportunity to work in this laboratory is that our research focuses on biochemical mechanisms that have a great deal of clinical use.
Some of my initial work in the Pollock lab worked with verifying inhibitors of our protein of interest, MEMO1. I conducted several fluorescence polarization assays to verify the inhibitor constant for the molecules a former Pollock lab member synthesized. A fluorescence polarization assay is one way that a pharmaceutical company may investigate the bioactivity of a molecule when finding potential medicinal uses from newly synthesized compounds.
Some of the most important research that takes place in the healthcare industry is drug development. Pharmaceutical companies must focus on examining four different areas of a drug’s identity: absorption, distribution, metabolism, and excretion. The drug development process usually begins with target development. After target development, the company or research group commonly utilizes high throughput screening techniques to look for potential chemical structures that inhibit or bind to the target. These high throughput techniques typically utilize microarrays and are capable of assaying 10,000 wells per day. The fluorescence polarization assay used in our lab is a medium-throughput assay because we don’t have robots to set up everything for us!

Fluorescence polarization, shown in the figure above, works by binding a small fluorescently labeled molecule to a larger molecule. When the labeled molecule is attached to the larger molecule, the light emitted from the labeled molecule is polarized due to the slow rotation of the complex. Conversely, when the labeled molecule is not bound to the larger molecule, the molecule spins in solution more quickly, thus resulting in the light emitted being depolarized. If you want a simple description of this assay, I suggest you read this blog post from one of the Pollock lab alumni.
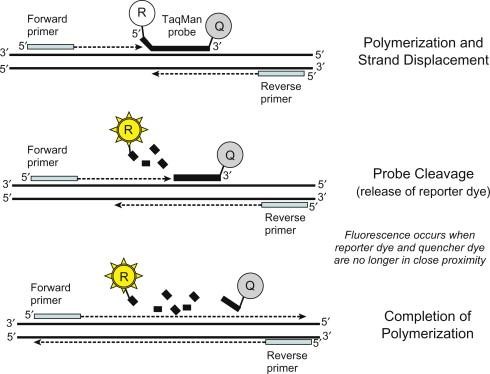
Another frequently used assay in clinical research and diagnostic is quantitative polymerase chain reaction. This technique uses TaqMan technology to quantify gene expression or the presence of a gene or nucleic acid sequence. qPCR has been the primary technique used during the COVID-19 pandemic for the detection of the SARS-CoV2 virus, primarily due to the cost savings and simplicity when testing large numbers of samples. Labs like ours utilize qPCR to monitor gene expression or relative abundance of an organism after treatment.
TaqMan technology has two main components, a reporter dye and a quencher. The quencher is excellent at absorbing light at specific wavelengths, meaning they act like blackout curtains for certain colors. When the quencher is near the dye, the curtains are closed, and no light is emitted by the sample. When DNA polymerase reaches the probe with the reporter dye, the dye is released from the primer sequence, and the curtains open. The dye can now shine bright, and the sample emits fluorescence that is visible by cameras with high-end filters. There are several different PCR methods that rely on TaqMan technology. Real-time PCR (rt-PCR) takes a photograph at the end of each cycle and quantifies the amount of light being emitted in a sample. Whereas endpoint PCR simply takes one picture at the end of 45-55 cycles of PCR and measures the total light emitted by the dyes and compares them to the blank.
One commonality between the two methods is the presence of a fluorescent tag. This small tag can change the price tag of a peptide or primer dramatically due to the synthesis steps. Not only does the fluorophore add cost to the experiment, but it also adds time for the synthesis of probes. These are two persistent problems research groups face when conducting research and are certainly issues we have encountered in the past. There are many more techniques used in an academic or clinical setting; however, these are two that I am most familiar with. With many years ahead of me in my biomedical career, I know there are many more techniques to learn. I am eagerly anticipating the time in my life when I am using my lab skills and career to improve people’s health.
– Ted Corl c/o ’23
Citations
Arkin MR, Glicksman MA, Fu H, et al. Inhibition of Protein-Protein Interactions: Non-Cellular Assay Formats. 2012 Mar 18. Assay Guidance Manual. Figure 2: Diagram of a fluorescence polarization assay. https://www.ncbi.nlm.nih.gov/books/NBK92000/figure/ppi.F2/
John M. Butler. Advanced Topics in Forensic DNA Typing: Methodology, Chapter 3 – DNA Quantitation. 2012. Academic Press. Figure 3.4: Schematic of TaqMan (5’ nuclease) assay. https://www.sciencedirect.com/science/article/pii/B9780123745132000038
Recent Comments