
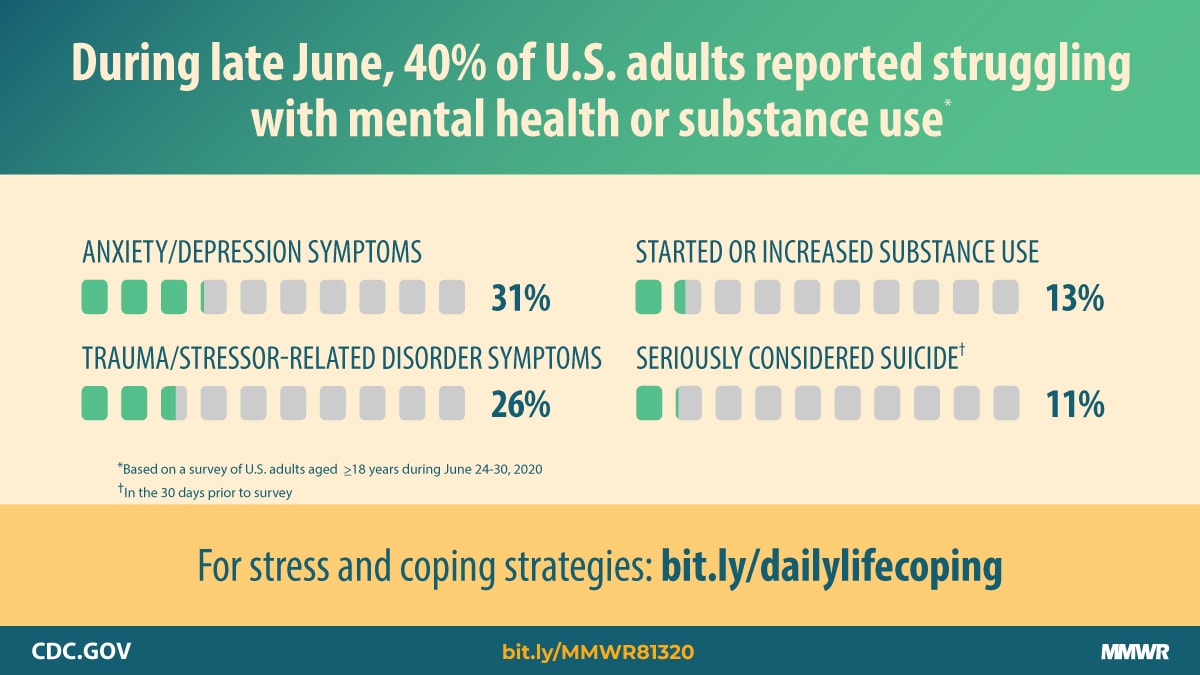
The chart that I picked is from the CDC regarding mental health during the Covid-19 pandemic. I find this chart fascinating, specifically because I think a national mental health crisis is going to be one of the biggest issues we face as we try to return to normalcy. Specifically, I appreciate the ways in which this chart is choosing the depict the information necessary. Instead of making the information seem much more intense than it is (These numbers are terrifying, don’t get me wrong, but I feel like other charts that I’ve seen on mental health always try and make it seem like everyone is just miserable all the time), the CDC choose to display their information in a proportionate way. Additionally, in regards to the reading, I feel confident in the bias that this source may have with its data. Luckily, because of the pandemic, I believe it is safe to assume the CDC is a reliable source, whose main concern is public safety. Unlike other charts on mental health that I’ve seen, this one isn’t trying to “sell” you on some sort of action you should take on your mental health. Mainly, I believe its purpose lies in educating and validating the experiences of US citizens.
The chart mentions that the data collected and reflected is not only from a very specific time frame (June 24-30, 2020), but also from a more narrow age pool. Because mental health issues in teenagers can be seen as more complicated (Hormones change the way we perceive things and can have a huge impact on what causes our mental health crises), I find greater validity in this chart because they chose to omit teenagers. Additionally, every section of their data has been distributed into different subsections outside of just 40% of adults feeling like their mental health is worse. They also acknowledge some of the more complicated forms of mental health issues (Like substance abuse) which allows for us to get a more genuine idea of what is happening and what is causing things to happen.
Mental health awareness is one of the largest social issues that I consistently see. With the pandemic, it has definitely become more problematic. This graph does a great job at explaining where these figures originate from and gives the time frame of when the data was collected. It makes the graph more representative of the actual situation and less objectified.
Hey Sofie! I actually did a similar graph for my entry about the mental health impacts of COVID-19. I like your graph as it breaks down specifics a bit more and talks about substance abuse as well. These are all very important things to consider right now as we all navigate this new world we live in and I appreciate that you shared this. I also like that it gives a direct link to where people can learn more about the information they are providing instead of just having to take the graphic at face value.
I really like the graph you chose because I think now more than ever this is a topic that needs to be discussed. I actually just wrote a paper about this for another class and mental health disorders are and have always been stigmatized, but with the increase due to COVID-19, there is a push to get people to talk about them. Thank you for sharing!
I find the topic of mental health during covid very interesting, I have noticed declining mental health, lack of motivation, and overall loss of hope amongst myself and 99% of my friends. Educating the people on this is important because mental health is so often stigmatized and people need to realize how widespread of an issue it really is.