
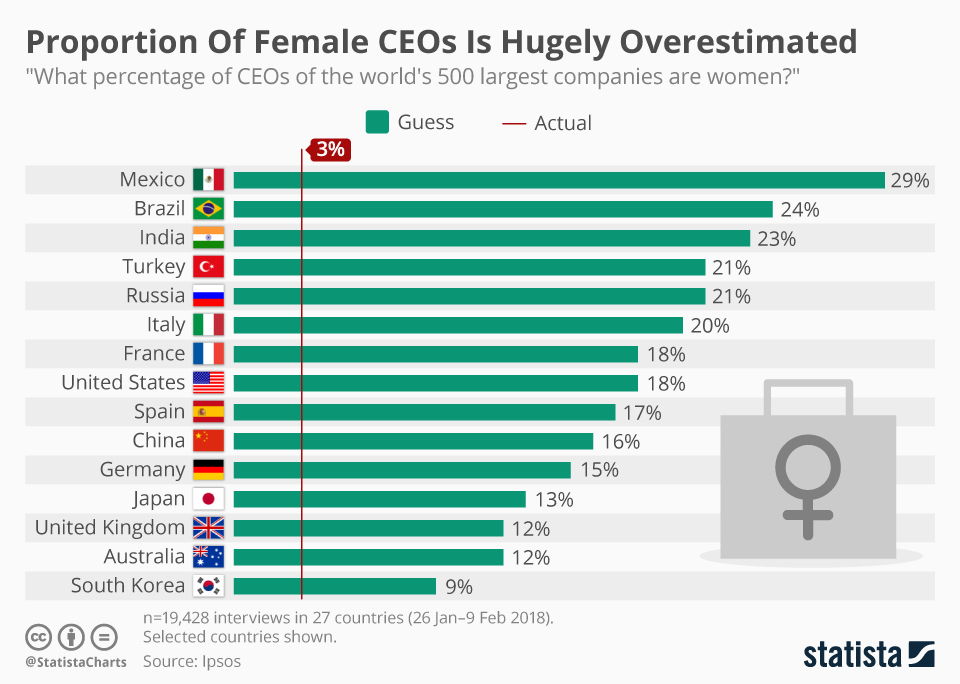
I found this chart very interesting, as it asks people from different countries what percentage of Fortune 500 CEOs are women. The results are very interesting as there is a huge overestimate, leading with Mexico who assumed 29% of the CEOs to be women, when in reality only 3% of Fortune 500 CEOs are women. This chart provides ample information, especially by outlining the question asked and the percentages asked. However, it does not list how many people participated in this survey per country, it only presents the overall number as n=19,428, making me believe the information may be skewed. Like noted in the podcast, statistical charts will purposefully exclude information to present skewed or biased information. Also, it would be beneficial to note the demographics of people asked: racially, socioeconomically, and age–all, which can provide very different results. Additionally, we do not know how the respondents were contacted, so that could have an effect on the results. Ultimately, I thought it was interesting that people all over the world overestimated the percentage of women as CEOs, but the reliability of the chart is questionable.
I completely agree – I know in the podcast Dr. Bezio talked about the pool of respondents and how that might skew the data, but you would not know as the information about who is being surveyed is not portrayed. There are definitely a lot of different ways that a chart/graph could be incorrectly portraying the information and the only way to know that the survey is truly being taken most accurately or not is by organization being completely clear about how the survey is being taken. This is when it is important to do your research on the source to see how reliable it is and look closely at what you are reading/taking in.
I agree that this graph could be easily skewed. One thing that I thought of was whether the person asking the questions was male or female, which the reading said could change the outcome of the study. Because of social desirability, someone would likely guess higher if they were answering to a woman instead of a man, which could explain why Mexico was so much higher than the others.
Margot’s comment is a great point! I think that social desirability and playing into the perceived wants of the interviewer/those around the person answering is something that would definitely be worth considering. The graphic could definitely do a much better job breaking down demographics and specifics as its hard to derive much useful information from it. For example, people in certain regions of the countries may have different social views of women and thus answer differently.
I really liked how you connected your chart to Dr. Bezio’s podcast. I think you bring up an important point that it’s hard to tell if this is a reliable source. I think this is an important question we must ask ourselves before trusting information we take in.
I thought this was really interesting as well. If the data is correct then this is graph would show great inaccuracy in guesses, all over the world. However, like you mentioned, graphs like this can be manipulated to appear as something they are not. All of us need to examine catching graphs, like this, with a critical lens so we can avoid falling into the trap of misrepresented information.
I agree that the reliability of this graph could be questionable, for it is important to know how many people from each country are taking part in the survey. Additionally, I find it interesting how some countries, such as South Korea, while they still overestimated the number of female CEOS, was only off by 6%. I wonder if this has to do with the perceptions of gender roles in this country and its culture, and I think it would be interesting as further research to look at the impact of gender roles in these countries that both overestimated by a small and by a large margin.