Identify is a monthly series here on the SAL blog, focusing on students, faculty, and alumni of University of Richmond who have used GIS in exciting ways. Come by each month to learn more about the interdisciplinary nature of GIS here at UR.

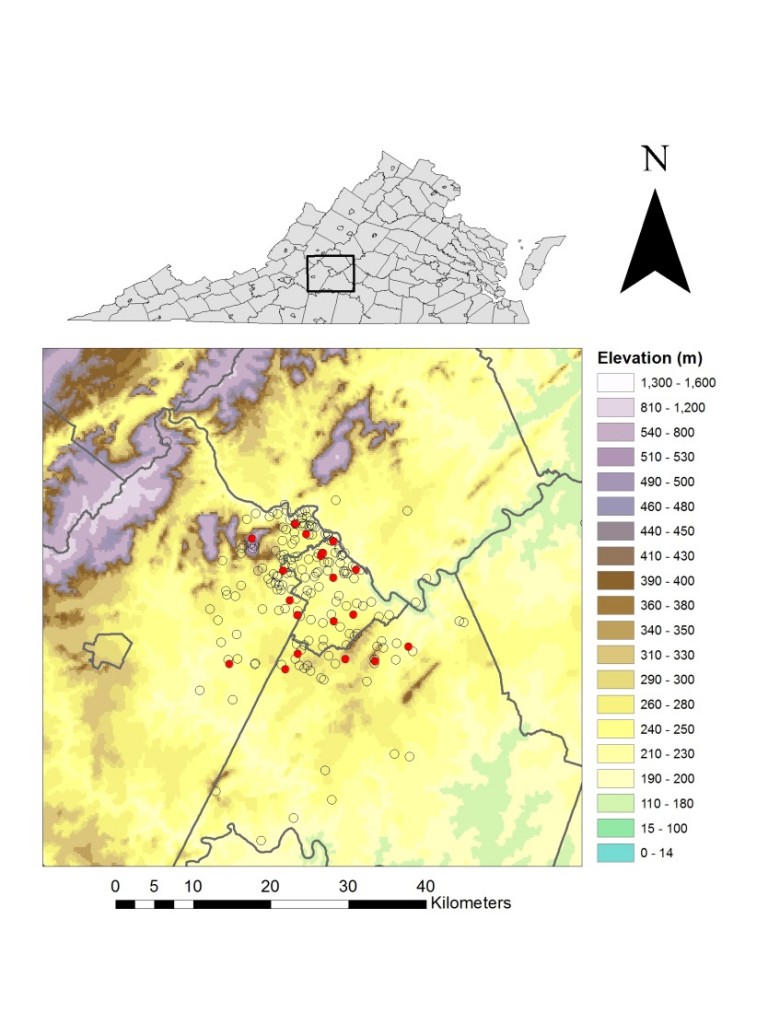
Dr. Brinkerhoff and his students created this map showing Lyme disease presence in dogs near Lynchburg, Virginia.
Undeniably, one of the University of Richmond’s most popular majors is Biology. Yet the University recently created a new, related major called Healthcare and Society which is quickly rising in popularity. The Healthcare and Society major teaches students how to understand and examine “the business, legal, ethical, interpersonal, and sociopolitical aspects of healthcare delivery, finance and organization,” says the University. As a result, the Spatial Analysis Lab has seen many students taking GIS classes because they want to learn how to tie together spatial analysis with global health.
Biology professor Dr. Jory Brinkerhoff has helped usher in this new interest in health-oriented GIS. He teaches a popular course titled Eco-Epidemiology which serves as an elective class for both the Biology and the Healthcare and Society majors. Dr. Brinkerhoff writes the following about his GIS-informed research:
Researchers have long studied the intersection of geography and disease; as any epidemiology student can affirm, arguably the first epidemiological study was done to identify spatial clusters of cholera in London in the 1850s. The reason for the association between these two disciplines is straightforward: people want to know exactly where they might face exposure to a nasty disease, both now and in the immediate future. Just as the first epidemiologists were fascinated by patterns in time and space, modern epidemiologists spend much of their time thinking about the same phenomena. However, although many questions about disease have remained unchanged for centuries—who? what? where?—our capacity to explore disease pattern and process has developed substantially.
I personally think that investigating and mapping disease risk is one of the most exciting aspects of public health research. As an ecologist, I am trained to look for patterns in time and space. As an epidemiologist, I look specifically for patterns that shed light on factors that affect someone’s chance of being exposed to or contacting disease.
My current research focuses on Lyme disease and how its spatial distribution in Virginia is changing. My students and I approach this problem from lots of different angles: we use field sampling, analysis of human case data, molecular genetics, and
immunological assays to figure out where risk to this disease is highest. In a recent project, two of my senior class students collected and mapped canine blood-test data to determine if there were any elevational patterns that might explain Lyme disease risk in dogs (yes, dogs can get Lyme disease, too!) These students used GIS to digitize and georeference a binder’s worth of positive and negative test result data for Lyme disease as collected from a veterinary clinic in Lynchburg, Virginia.
We then used a geo-statistical test to see if variation in elevation is associated with exposure to this tick-transmitted disease. In the map [see above], positive test results are indicated by red circles and negative test results are indicated by open (hollow) circles. Our preliminary results suggest that dogs—and probably humans—that live at higher elevations are at increased risk of exposure to Lyme disease. This finding is especially important for the Lynchburg area, as that major city lies near the base of the Appalachian Mountains. Interestingly, our analysis of field data for human cases suggests the same result—keep this in mind the next time you head up to the mountains for a hike!
The Spatial Analysis Lab thanks Dr. Brinkerhoff for writing about his research for our blog. We look forward to helping Biology and Healthcare and Society students as they continue their epidemiological research!
