This exercise uses data downloaded from the EPA’s EJScreen: Environmental Justice Screening and Mapping Tool as well as American Communities Survey data to explore environmental justice in the Richmond, VA region.
Follow this link to the ArcGIS Online Map created for this exercise.
Explore the data available in the pop up windows by clicking on a block group.
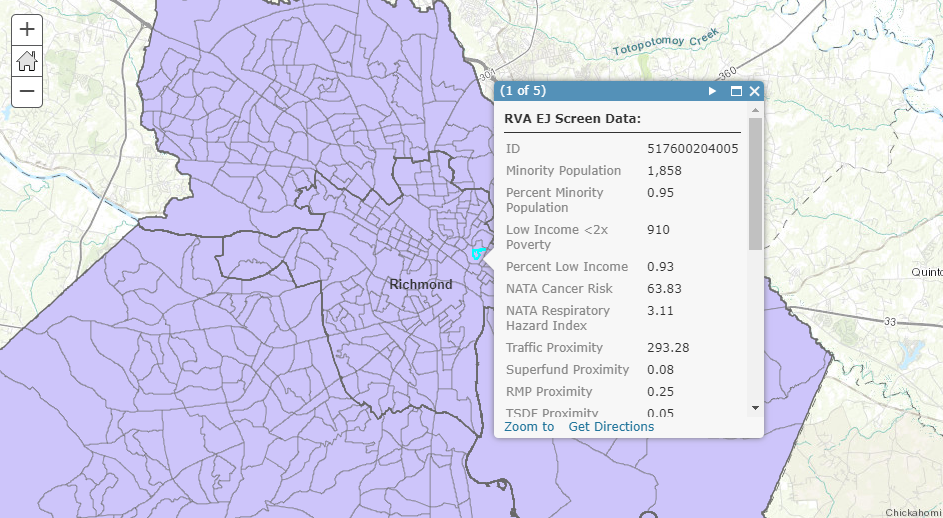
Click on a census block group to display the pop-up with the attribute data for that block group
Open the Attribute Table to see data for all block groups
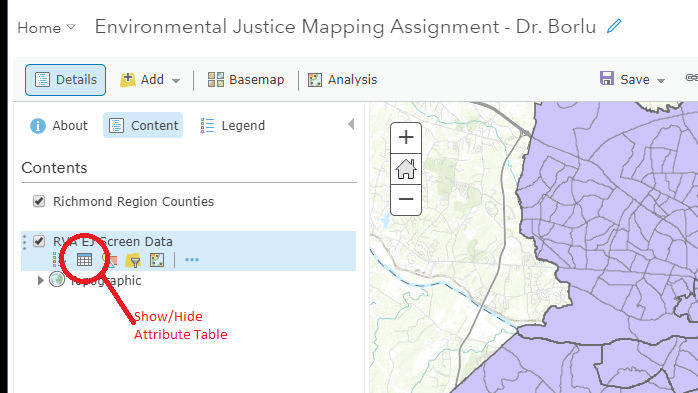
Click below the data layer in the Contents Pane to show/hide the Attribute Table for that layer
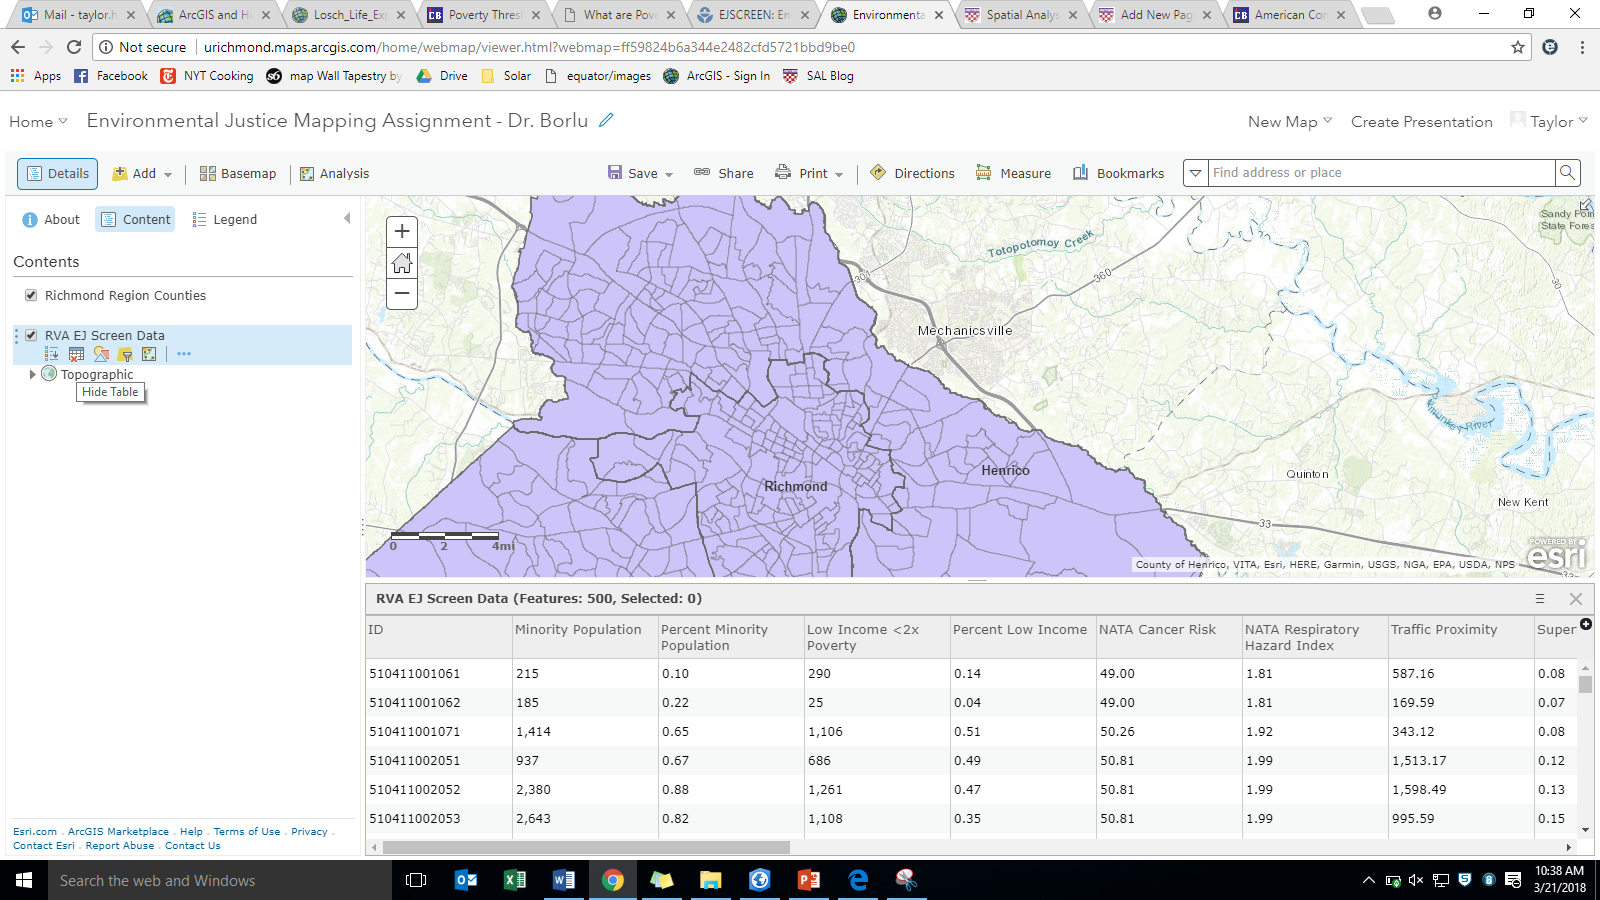
The attribute table will appear at the bottom of the screen. It can be resized and filtered to only show selected records
Lastly you can Change Style to symbolize your layers according to the attribute data (ie poverty rates, NATA cancer risk, or total minority population)
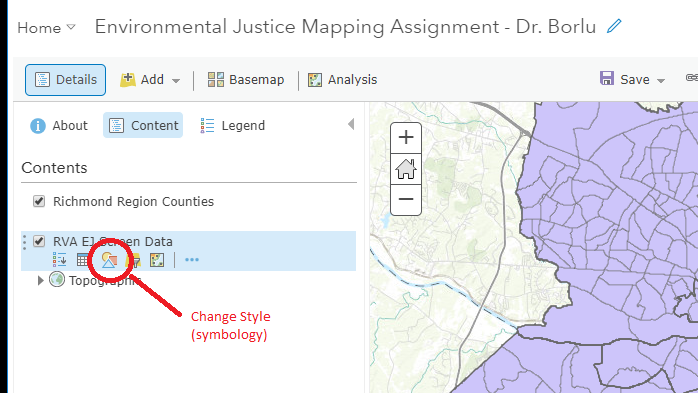
Click below the layer in the Contents Pane to change the style for that layer
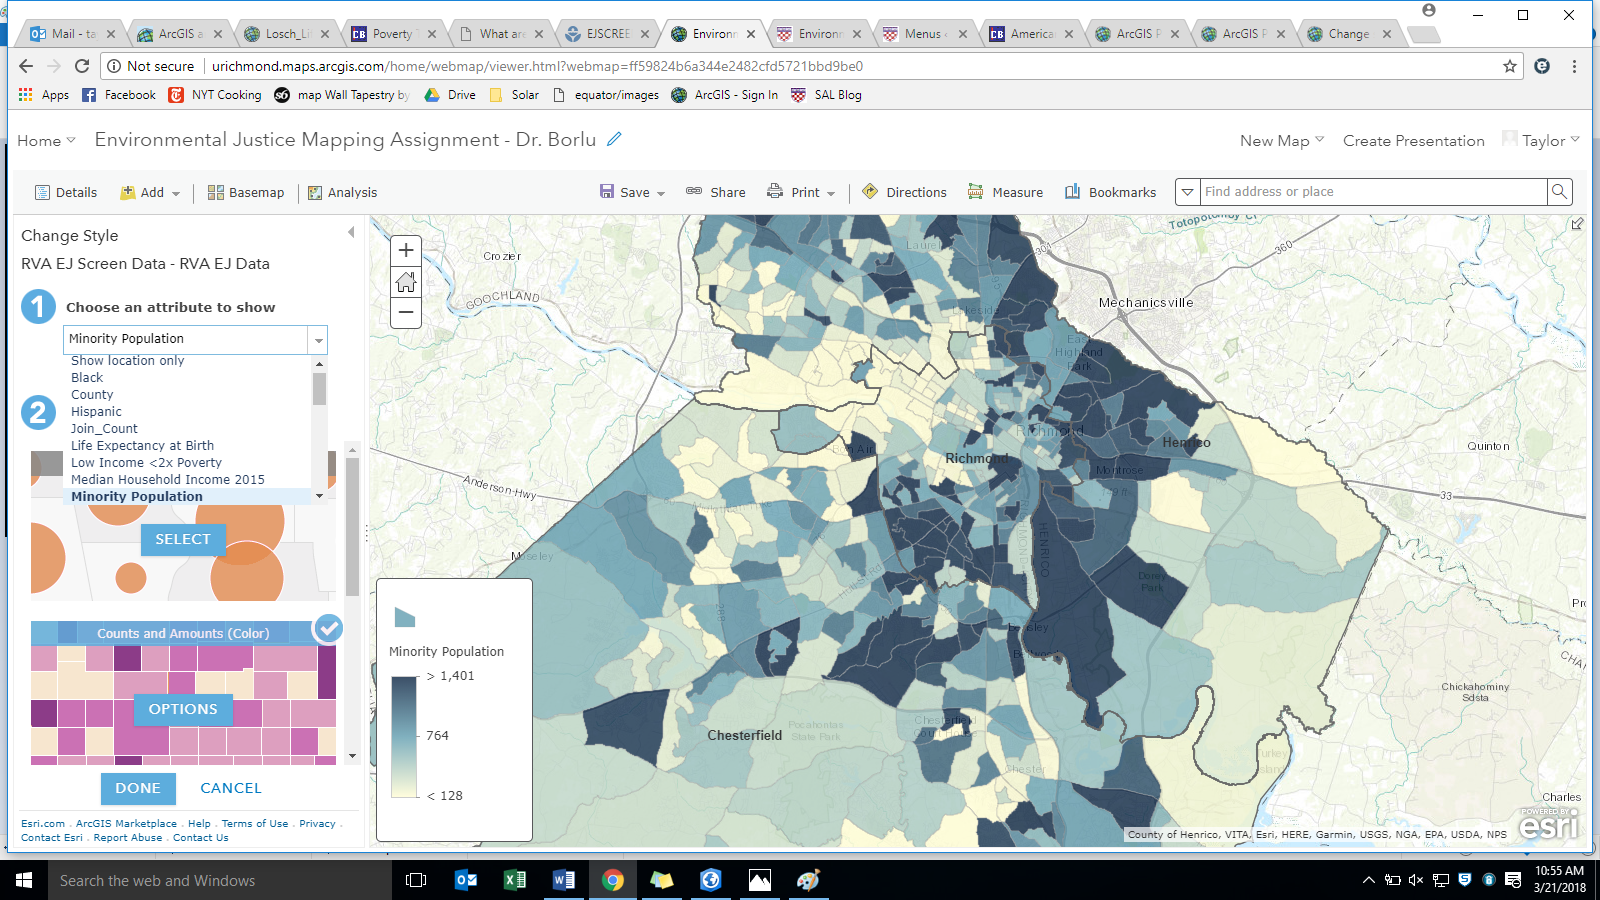
You can choose any of the available attributes to symbolize your layer. It can be symbolized in graduated colors (pictured here), graduated symbols, categories, or single style.