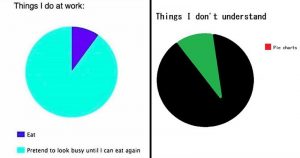
Since I am a humanities major mostly due to my inability to work with numbers and statistics, i thought this chart was really funny. I will admit I did not have a favorite chart until I found this one, but I thought it was fitting for that reason and also because I work at Passport Cafe and have to stare at all that delicious food for my whole shift. Moreover, I am glad that critical thinking gives us the skills to analyze arguments in this quantitative form because, as Dr. Bezio mentioned in the podcast, that is often how people choose to back up their humanities-based arguments. I had also never really though about it before how data and statistics are often used to support evidence of demographics, but on second thought even the giving games paper that we just turned in that had sections just about ethics had some numerical forms of evidence. Overall, I will now look at numbers in a much different light when thinking about arguments. More specifically, I will think about how they are used within the argument and if it makes sense or aims to be deceiving, rather than just glancing at them and pretending I understand.
Critical Thinking


I have always been told Pie Charts are the worst choice possible unless your goal is to deceive the audience. They typically only work when trying to illustrate a point, not explain data well.
I love your choice of graphs 🙂
Your point about numbers being everywhere is so true! Thinking critically about statistics and numbers is an essential skill that you can learn, just like learning how to critically read an academic paper! However, numbers can be scary, and for me at least, they take a lot more time to process than reading words. Unfortunately, this can lead to skipping over important information. After seeing just how easily they are manipulated and how common they are, even in non-numbers topics, I’ll be joining you on think through the choice and presentations of numbers a bit more closely.
(And also, pie charts are not inherently bad or deceptive! They are great when you want to show percentages and parts of a whole, for example, looking at how much of your weekly budget you spend on snacks)
I think oftentimes we assume that when we see a number or a statistic that it must be true, but numbers, just like words, have the ability to be deceiving, as you said. It is important to understand the numbers and the statistics rather than just believe they are true because they are supposed to be true. And, even if the statistics given are true, there is always the possibility that they are placed in a certain context in order to persuade people one way or the other.