
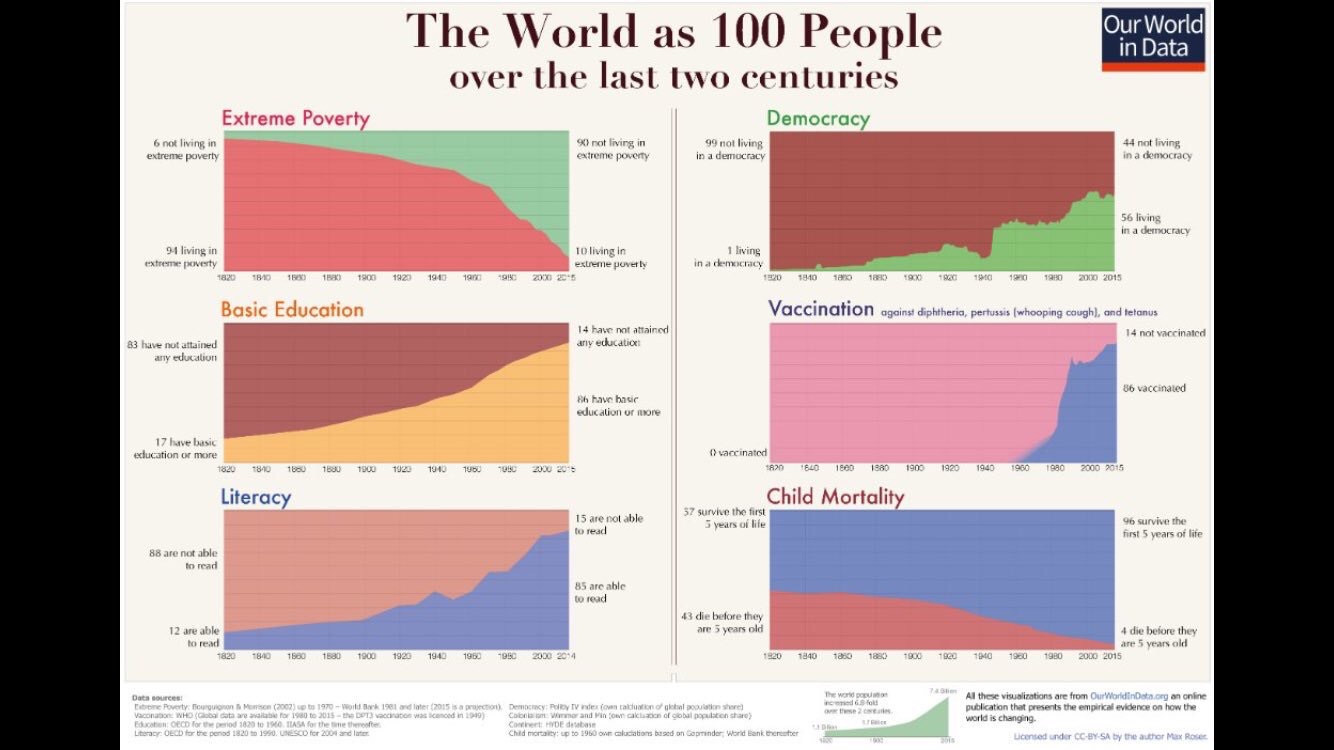
I know there are multiple charts here, but I like the way that they all work together and show the changes that have occurred in the world over the past 200 years. The reason I find this so intriguing and worth taking a look at is because it is positive. There are so many things that need changing in the world, and a lot of those issues are prevalent today, but it is sometimes nice to take a step back, without ignoring what still needs to change, and see how far we have come over our relatively recent history. In all six of the categories shown in the chart, things have gotten better gradually with the negatives decreasing and positives increasing. Interestingly, the two places with major dips in progress are democracy and literacy, both occurring at the time of World War II. I think it is so cool to look at charts like these and see the way major events affect specific parts of society and progress. I would like to see these charts up through 2020 as well to see how things change with respect to the pandemic. These six topics might not change much, but it will be interesting to see the lasting effects of the pandemic on other categories, like mental health, trust in government, etc.
What is also a positive about this chart is the lack of bias there is. The only end goal in these statistics is to educate people and help them better understand the world we are living in. In comparison to other charts that might be aimed at advertising to try to get people to feel a certain way about a product, group, or individual, this one does not have an ulterior motive, which makes the facts that much more believable and the source that much more trustworthy. In this globalized and media-driven world, we are constantly flooded with opinions, ideas, and information, and it can get tedious and difficult to sift through it all to find the sources and information that are trustworthy and worth looking into. When there is information like this one from the World Bank it is a refreshing change from the people and businesses who are trying to convince us to believe what they believe.
I like these charts too – I think so many times organizations will zoom too far in on the information and portray a smaller snapshot of the topic. I think this information showing the bigger picture is important especially seeing how things have evolved over the past 100 or so years and that helps the information be portrayed more accurately. As you mentioned, I think that the lack of bias from this chart is really great as in so many case creators of graphs will gently input their opinion through titles or labels.
These are really interesting charts! I also agree with you and Evie that the lack of bias in the charts is great as titles of charts often push us one way or another as well. I do find some of the colors to be a bit distracting and in some cases difficult to interpret, but on the whole I think the information is presented really well.
I really love this chart and it helps me keep a more optimistic view of the world. With so much constant negative news, one can forget the amount of progress the world has made in the last 100 years. The statistic portrays the information in a very clear way and the lack of bias makes the information very trustworthy.
I like this chart as well, largely in part due to the broadness of it. Oftentimes, charts like these can be almost too specific, but by leaving things more broad, the creator of this chart seems to avoid some of the biases seen in other charts. I think however it may be too broad. It does not define what it means to live in extreme poverty or to receive a basic education, however it does clarify what vaccines it is talking about.