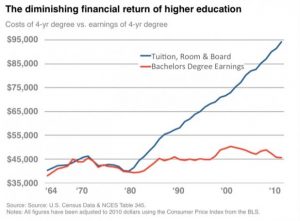
I think this graph is interesting because without any context, it makes sense and the viewer will initially accept the idea that college is not worth the immense cost because it will not produce sufficient earnings. However, there are a few key facts and statistics that this graph leaves out that disprove this idea. First, it fails to show that having a college degree will produce far greater earnings than a high school degree. This gap in incomes between education levels has actually greatly increased since 1964, making a college degree more valuable today than in the past. Additionally, the earnings represented by the red line are for initial positions and starting salaries, which are typically far lower than one’s salary would be at the retirement age of 60 or 70 years old. When these salaries are taken into account, college degrees return far greater sums than their initial cost and end up being far more valuable in the long term. Rather than a short-term gain, a college education is long-term investment that will yield good results with time, not right away. Studies have shown that “the $102,000 investment in a four-year college yields a rate of return of 15.2 percent per year,” which accumulates to a far greater amount of money than its initial cost.
The key reason that this graph is so misleading is because it fails to account for the other options, which show that it is not the college education system that is failing us but inflation and lack of salary increases to match it. The cost of living has skyrocketed across the globe over the past few decades, but wages have remained relatively stagnant across the board. A college education has increased in value simply because of this inflation, and the economy has not yet matched it. This is the real reason that so many college students are drowning in student loan payments that they cannot avoid or afford to pay.
Thompson, Derek. Hey, Everyone, Don’t Fall for This Misleading Graph about College Costs. 8 June 2012, www.theatlantic.com/business/archive/2012/06/hey-everyone-dont-fall-for-this-misleading-graph-about-college-costs/258299/.


You did a phenomenal job critically analyzing this graph! You pointed out things that I had not considered before. For instance, I did not consider how inflation and the rise of the cost of living could be the leading factors as to why college students feel as though their investment in a collegiate education is not worth it in the long-run.
I really liked how you focused on what the graph was missing and failing to convey rather than what the graph is trying to convince someone of. It’s easy to make the comparison to other generations about college, especially when talking about tuition costs. I agree that it’s necessary to include and talk about all factors when discussing a graph or chart.