
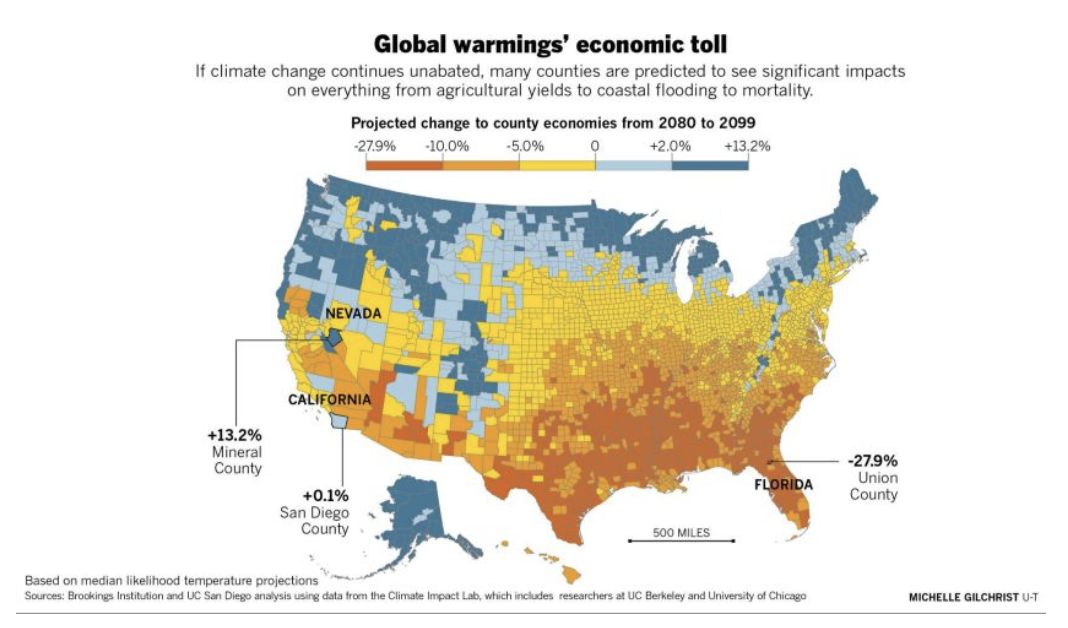
This is a pretty recent graph from 2019 based on information from a study at the University of California San Diego and the Brookings Institution. In the article that I saw this image from, it said that, “Now a new report from the University of California San Diego and the Brookings Institution says the states that tend to vote for politicians opposed to reining in greenhouse gases are likely to suffer the harshest economic toll from climate change. David Victor, a researcher at UC San Diego’s School of Global Policy and Strategy and contributor to the Intergovernmental Panel on Climate Change, even said that “The damages to the Republican-electing congressional districts is almost double what it is for the Democratic-voting districts.”.I thought that this was really strong language that indicated causation instead of correlation. More information can be found here: https://www.sandiegouniontribune.com/news/environment/sd-me-red-state-climate-impacts-20190131-story.html.
You bring up a really good point about how the language surrounding a chart can change the impact that it has. Politics is surely a place where charged language is used to indicate more than meets the eye and this chart is a really great way to exemplify that.
This is a great point. Like the reading mentioned, how we frame data with words makes a huge difference in the audience’s interpretation of the numbers. This seems like a perfect example of a researcher oversimplifying their data to make it work with the conclusion they want to write.