
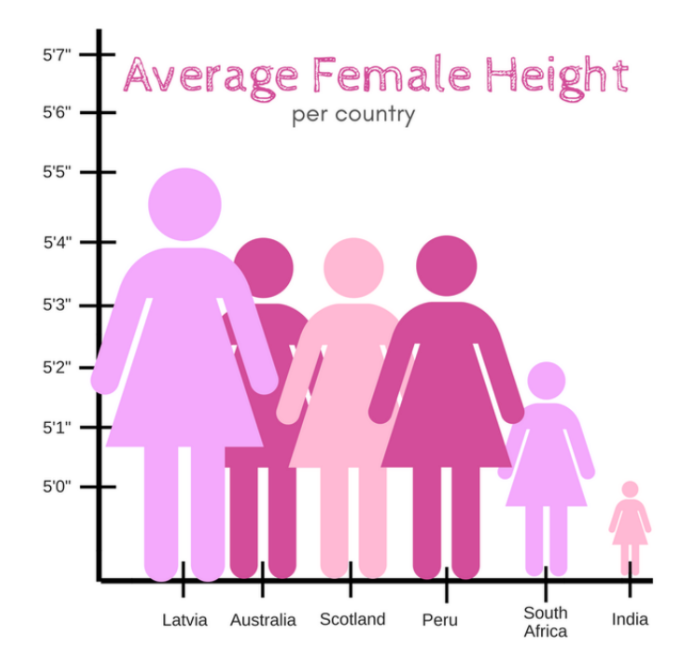
I discussed this chart in my Quantitative Social Science class which is supposed to display the average female height per country. The title is clear and the x-axis is labeled well, but beyond that is where the problems begin and the graph becomes less representative of the main goal. The y-axis measurements paired with the use of a female stick figure visually misrepresent the actual difference between the female heights in the different countries. The y-axis starts at 5’0” and only goes up to measure 5’7”. The tallest females are in Latvia at 5’5” and the shortest is from India at 5’0”. That’s only a 5 inch difference, yet the size of the figures representing India and Latvia suggest the size difference is very noticeable, almost extreme. The larger the stick figure gets as well, the wider the figure becomes. This effect subconsciously makes us also picture a much skinner, tinier woman in India than in Latvia which is not supposed to be represented here at all. Whoever made this chart, let the desire to make the chart look appealing overshadow the goal to present the information in a straightforward way.
From the reading this week, I found it interesting to read how misleading information manifested in 1954, when Huff wrote the book, in comparison to 2021. There were two points specifically that stood out to me. First, he claimed that “some of the strongest feeling against public-opinion polls is found in liberal or left-wing circles, where it is rather commonly believed that polls are generally rigged” (Huff 28). This claim echoed the sentiment felt throughout the most recent presidential election, but not necessarily most represented by “liberals or left-wing circles” (28). The public had a hard time trusting the polls whenever they said their candidate wasn’t going to win. It’s disheartening to read that even in 1954 sentiments like this were noteworthy to discuss and we continue that conversation today instead of making any real ideological change. Furthermore, the second point that stood out to me was Huff stating that “public pressure and hasty journalism often launch a treatment that is unproved, particularly when the demand is great and that statistical background is hazy” (43). The pressure for news outlets to provide information first or to have this amazing breaking news story still applies today, almost 60 years later. Many examples exist of news platforms misreporting a story because they had the wrong information and did not take the time to fact check themselves or they chose to create a narrative that they didn’t actually have evidence for, but it was entertaining. I think some of the charts that we all picked probably reflect these poor journalism habits as well.
I think this graph is super interesting not just because of the reasons you stated, but also of the other subliminal stereotypes being fed into the graph. For example, why are all the figures pink? Is it to make the chart appear more “feminine”? Also, what’s with the bathroom-sign-like figures anyways? There’s a lot to go into this graph and I’m glad you shared it because I think this would be an important graph to navigate sexism and feminity through.
I think that the graph you chose is a great representation of how much of an impact data presentation has on our interpretation of it. High level advertising definitely takes advantage of this, making it easier to tell the story they want to. In terms of creating the least bias possible, I think it is best to present the data as simply and clearly as possible and let individuals interpret it on their own.
You’re right, the distrust of media is disheartening. I don’t know that this distrust necessarily comes from an increase in poorly conveyed or intentionally misleading statistics, but I think technology has led to people being more wary of the ways that they can be deceived. It’s already difficult for Americans to see eye to eye on anything, and the difficulty is multiplied when we don’t even have universally agreed upon facts.