
The readings and podcast were extremely interesting to me. It all sounded very familiar as I am also majoring in psychology and a big part of that subject is dealing with data and statistics. While it sounded familiar, it was interesting to look at it through a leadership lens. In the podcast, Dr. Bezio discussed the importance of looking at what information is collected and how. Specifically, she talked about numbers in statistics and how they are presented. I think the presentation aspect stuck out to me most because it isn’t something I’d normally think about. The example Dr. Bezio mentioned was that saying 1 in 4 people will be asymptomatic with COVID-19 sounds different than saying there is a 1 in 4 chance of winning. I’ve never really thought about the fact that while these chances sound slightly different, they are actually exactly the same.
Another thing that stuck out to me was in the reading when Huff discussed the different types of correlations. A correlation can happen completely by chance. It be a real correlation, but you can’t tell which variables are the cause and effect. Lastly, it can be a real correlation but the variables don’t affect each other at all. I think for me this was most interesting because I have always thought of correlations as something that means the two variables effect each other. I also thought it was very interesting that correlations can be real and still be worthless to the data. Personally, I have always thought that if there is a correlation, it is showing something and is meaningful to the data. Thinking more about it in terms of leadership and what we’ve been doing, this makes sense to me when I think about the articles we’re reading for our project. Some of the articles have correlations that mean nothing to our subject. I’m not sure if this is exactly what Huff was saying, but this is what I took from it.
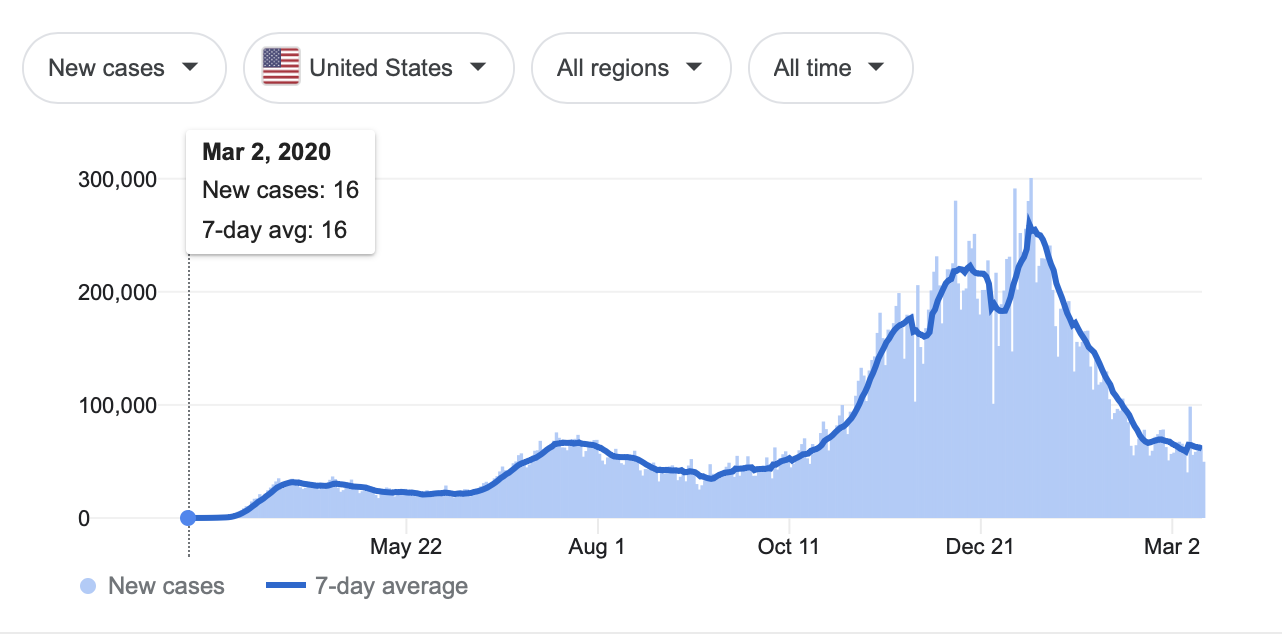
This is my favorite chart because it shows that we are FINALLY going down with COVID-19 cases instead of up. Hopefully we remain this way.
You bring up a really good point in that sometimes correlations can be present but don’t mean anything. Recognizing this before making graphs is very important for not presenting inaccurate data in your graph.