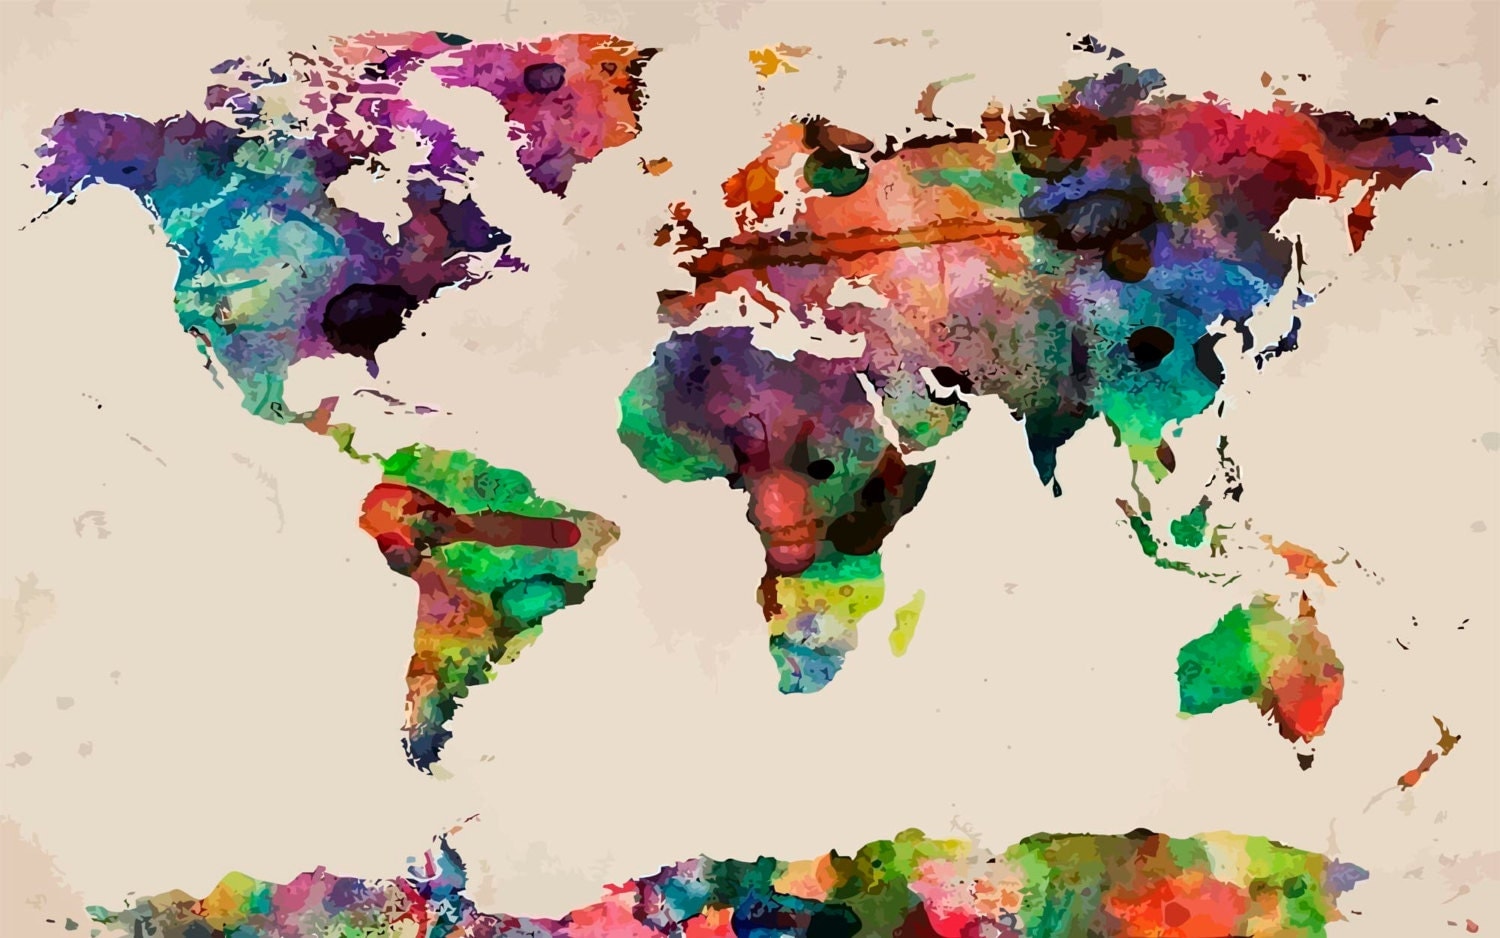
Maggie Latimer
I am taking Maps and Geovisualization for several reasons: it is relevant to my major, it fits into my schedule, and I know the professor (one of them, at least) and her style of teaching. This course also sounded like a good class to use as a transition into a more advanced GIS course, should I choose to pursue it in the future. I took Intro to GIS last year, and while I learned a lot and thought it was really interesting, I felt like my computer skills were not always up to par.
I really like the idea of investigating the artistic side of cartography and learning about how and why specific choices may convey particular meaning on a map. The concept of reading maps and recognizing how they can “lie” is extremely fascinating to me. I would love to do some evaluation of maps, in what ways they can sometimes be misleading, the mapmaker’s stylistic choices and what those choices entail, and how this can affect society on a greater scale.
One reason I love geography is because it is so versatile. It can be applied to almost any other discipline and adapted as both a scientific endeavor and an art form. Looking ahead to the future of GIS in the workforce, understanding spatial analysis seems to definitely be a growing skill that is rapidly becoming a much-wanted talent. Employers from many fields of various interests are looking for workers who know how to use spatial analysis software and have experience making different kinds of maps. For my own future (which is quite the scary thought), I’m thinking of possibly working in humanitarian aid and development. Nonprofit organizations, for example, utilize different types of maps that show social issues and solutions from small, local communities to a global scale. Maps can be used to show matters of public health, environmental changes, emergency response systems, and more.
Maps are a highly efficient tool when trying to convey a large volume of information about a place. I love studying maps as visual aids because they are often much easier to read than wordy reports. Complex information that is easily lost in complicated data sets or graphs can be clearly understood through a well-designed map.
For my projects in this class, I will explore the programs we use and learn to make useful, attractive maps that display worthwhile information. I want to learn how to recognize a “truthful” map versus a “dishonest” one. By the end of the semester, I hope to decide whether I am willing to go further with GIS in school and maybe even in my career. I’m excited to revisit digital mapmaking using a more artistic approach and develop my skills (and my confidence!) using ArcGIS.
