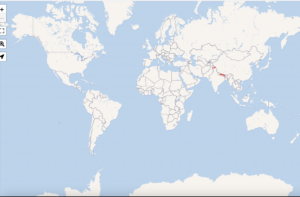
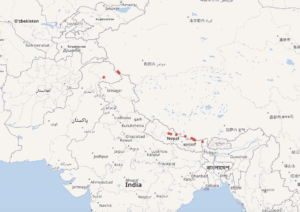
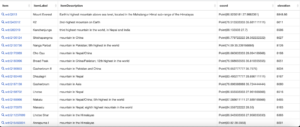
This is visualizing mountains over 8,000 meters in elevation. The information is best shown as a map and a table. The map effectively shows the locations of the fourteen mountain ranges with peaks over 8,000 meters. The map is helpful in seeing location and how close or far apart the mountains are to each other. It helps visualize what the landscape may look like in these areas. The table is effective at showing the names of the mountains as well as a description, coordinates, and exact elevation. An interesting point is how close most of the mountains are to each other, most being in Nepal. My experience with this visualization was very cool. Plugging in different visualization types was very interesting, finding out a map and table were the best forms to get the information out. The table was specifically clear in height providing the exact height, fro example, Mount Everest is 8848.86 meters in elevation. My plan for Critical Creation #1 is to create a visualization in the form of a table. A table will be the best way to organize and format different kinds of work and information by Brumsic Brandon Jr..


