
Measurement of Constructs-
When testing a hypothesis, we must measure constructs in a scientific manner. Some constructs are easier to measure like a person’s age, height, eye color. Other constructs might be harder to measure like prejudice, discrimination, problem solving, creativity, systems thinking, etc. This chapter examines the creation of measurements for constructs that are harder to measure.
Conceptualization-
Conceptualization is the process of clearly defining vague constructs or concepts which allows the researcher to measure abstract constructs accurately. Our collective definition of such constructs are based on a shared “inter-subjective” in addition to our conceptions of these constructs. When conceptualizing constructs, one must determine whether it is unidimensional or multidimensional. A unidimensional construct has a single “underlying dimension” and can be measured using a single measure or test (weight, height, age). A multidimensional construct has two or more underlying dimensions and are usually more difficult to measure.
Operationalization-
After we conceptualize our construct we must determine how we will measure it. Operationalization is the process of developing “indicators” or items used to measure these constructs. The example used in the reading was socioeconomic status which is an unobservable theoretical construct. It can be operationalized using the “indicator” of family income. As Kenny spoke about in Chapter 1, there is a high level of subjectivity and imprecision linked with social science constructs. To combat this, it’s important to measure these constructs with multiple indicators.
These empirical indicators are used to represent a given construct or a “variable”. These variables can have several “attributes” or levels that represent a value. For example, rating your pain (variable) on a scale (attribute). Attributes can be quantitative or qualitative. Quantitative data can be sorted using data analysis techniques whereas qualitative data requires qualitative data analysis techniques like coding.
Levels of Measurement:
Levels of measurement, which can also be referred to as rating scales, are the values that an indicator can take. Psychologist Stanley Smith Stevens defined four generic types of rating scales…
Nomail-
Measures categorical data and is used for variables or indicators that have mutually exclusive attributes. To measure central tendency for a nominal scale you can use mode. Usually chi-square and frequency distribution are used.
Example: Eye color (Brown, Blue, Green, Hazel)
Ordinal-
Measures rank-ordered data. To measure central tendency for an ordinal scale you can use median or mode. Percentiles and non-parametric statistics can be used for statistical analysis
Example: End of the year class review (strongly disagree, disagree, neutral, agree, strongly agree)
Interval-
Measure rank-ordered data that is equidistant from adjacent attributes. This measurement allows one to examine “how much more” one attribute is compared to another which isn’t possible with nominal or ordinal data. A strong distinction of the interval scale is that the presence of the zero is arbitrary. Central tendency can be measured using mean, median, mode, range, and standard deviation. Correlation, regression and analysis of variance can be used for statistical analysis.
Example: Income ranges: A:($0-$10,000) B: ($10,000-$20,000) C: ($20,000-$30,000)
Ratio-
The ratio scale encompases all the qualities of nominal, ordinal, and interval scales but it has a “true zero” point. Unlike the interval scale, a zero on a ratio scale means that there is an absence of the variable you are measuring. All measures of central tendency can be used including geometric and harmonic means. All statistical methods can be used for analysis.
Example: Population size
Common rating scales:
Binary scales-
Binary scales are nominal scales, they consist of binary items with one of two possible values. If there is an option for more than two possible values then it is no longer a binary but it still is a nominal.
Example: Yes or no, true or false
Likert scale-
This is a very popular rating scale which is used to gather respondents’ agreement or disagreement. This scale is ranked from strongly disagree to strongly agree. The likert scale allows for more specific responses than binary items.
Example: Strongly disagree, disagree, neutral, agree, strongly agree
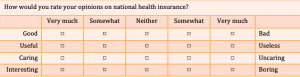
Semantic differential scale-
This is a multi-item scale where respondents are asked to indicate their feelings toward a statement using different pairs of adjectives. This one is harder to describe so I’ve added an example below.
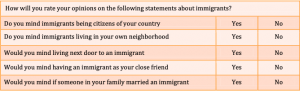
Guttman scale-
The Guttman scale uses a series of statements which increase in intensity as the respondent progresses. I think the text provided a great example of this scale as well so it is shown below.
Scaling:
The scales discussed above showed how to measure respondents’ responses to indicators regarding their construct. However a rating scale is not scaling. Scaling is the process of developing scale items before rating scales can be used for those items. This is where you assign a quantitative measurable unit with an unobservable construct. Scales can be unidimensional or multidimensional depending on the construct being observed.
Popular unidimensional scales:
Thurstone’s equal-appearing scaling-
This scale was a little confusing for me…Let me try to break it down.
The Thurstone scale is used to gauge the attitude of respondents towards a clear and unidimensional concept.
- Start with a clear conceptual definition of the construct of interest.
- Have a group of experts write down different statements about this construct which reflect different opinions or attitudes.
- Rating scale items: have the judges rate each statement on a scale from 1 to 11 based on how closely the statement reflects the construct
- 1 means extremely unfavorable
- 11 means extremely favorable
- For each statement the mean and interquartile range are measured. These measurements are then plotted on a histogram.
- The final scale items are selected as statements that are at equal intervals across a range of medians. Within each value, the statement that has the smallest interquartile range should be used. This is the statement with the least amount of variability across judges. In addition to statistical analysis for selection, they also look over the candidate statements at each level and select the statement that makes the most sense and is the most clear. The median value of each scale item represents the weight to be used for clustering the items into a composite scale score representing the construct of interest.
Thurstone also created two additional methods for building unidimensional scales. The method of successive intervals and the method of paired comparison are both similar to the scale written out above except the judges are asked to make a judgement between each pair of statements rather than independently.
Likert’s summative scaling (most popular of the three)-
Likert’s summative scaling is a unidimensional scaling method.
- Start with a clear definition of the construct of interest
- A group of experts generate scale items (statements) that judges can express their degree of agreement or disagreement on a 5 or 7 point scale.
- Rating scale items: The judges must then rate each statement on the 5 or 7 point scale based on how much each statement indicates a favorable or unfavorable attitude towards the statement.
- 1 for strongly disagree with the concept, 2 for somewhat disagree with the concept, 3 for undecided, 4 for somewhat agree with the concept, and 5 for strongly agree with the concept.
- After this rating, items (statements) can be selected for the final scale
- Throw out any items that have a low correlation with the total score across all items or;
- for each item, get the average rating for the top quarter of judges and the bottom quarter. Then, do a t-test of the differences between the mean value for the item for the top and bottom quarter judges
Guttman’s cumulative scaling method-
Guttman scaling is also known as cumulative scaling which measures the extreme attitude of respondents towards a construct.
- Starts with a clear definition of the construct of interest
- A group of experts develop a large set of candidate items
- A group of judges then rate each candidate item as “yes” if they view the item as being favorable or a “no” if they view it as unfavorable
- The judges’ responses are organized in a matrix or table from the statement with the most “yes” answers at the top to the statement with the least “yes” answers at the bottom.
- A data analysis technique called scalogram analysis can be used to determine a set of items that best approximates the cumulativeness property
Indexes:
An index is a composite score calculated from measurements of multiple constructs using a set of rules and formulas. An index measures different dimensions of the same dimension of a single construct (see example). The process for creating an index is similar to creating a scale. First, you must define the index, then you must operationalize and measure each component, create a rule or formula to calculate the index score, and finally validate the index score using existing or new data.
Example: Consumer price index (food and beverages, housing, apparel, transportation, healthcare, recreation, education and communication, and “other goods and services)
Typologies:
Scale and indexes generate measurements of unidimensional constructs. In order to summarize two or most constructs you must create a typology. A typology is a set of categories or types which are multidimensional.
Question:
Most of this chapter was pretty straight forward about the different levels of measurement for constructs. However, one question arose during my reading… Will we ever have a clear, universal, and shared definition of these unobservable constructs? The first step in creating these scales, typologies, and indexes is conceptualizing or defining these multidimensional constructs. I guess my question is, how do we guarantee that the definition of these constructs is actually shared? Especially if the research is looking at other cultures and countries where some of these constructs are contested?
Brooke,
Good job on the review! As far as your question, I don’t know if we will ever have a universally accepted shared definition of some of these constructs. As you said, looking at other cultures and countries where they don’t share the same viewpoint on said construct is hard enough, but even closer to home, some of these constructs won’t be universally shared in America in today’s society. Not to get on a soapbox of all of the things wrong with our country, but hard to see constructs like prejudice or discrimination agreed upon any time soon in today’s society.