http://arcg.is/1Th21mj
http://arcg.is/1Th21mj
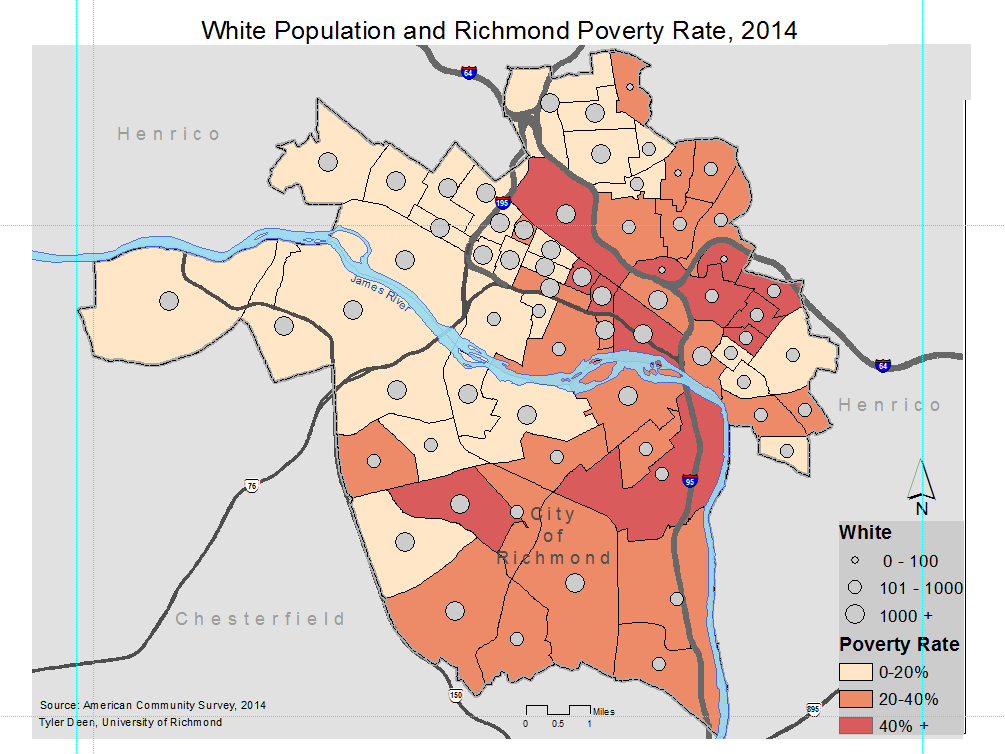
For my paper map, I would like to use the City of Richmond poverty statistics to recreate the map titled “White Population and Richmond Poverty Rate, 2014.” After “living” in Richmond for over a year and a half now, I am interested to see how the poverty rate as a population interacts with a specific race. The legend indicates the white population in poverty by a rate of 50 per white dot and shows the overall population poverty rate in shades of red. I would like to change the dot representation of the white population because with the lighter shades which are close to the color of the dots, it is difficult to see the difference in dot and shade. I could also incorporate a different outline color for the Richmond city limits so that it is more distinguishable from the dots. I also intend to add labels for the surrounding counties which would help to make this map better.

Until I had read this article, I had always thought of maps being used in history books and other literature to demarcate important events. The wide breadth of map use is fascinating to me as I continue to learn the many applications of them. The military negotiations were largely centered around the drawing of the map and had the Israelites known the significance of the map they may have drawn it differently. The biggest thing I learned about maps from this article is that people can interpret maps in different ways and the clarity of the message being portrayed by the map is very important. While today’s technology and programs allow cartographers an easier way to design a map, it is still just as important to take the time to create an effective map.
I have always loved learning about new things and have tried to gain a widespread knowledge of a diverse set of topics. The saying that knowledge is power has always resonated with me and I believe that studying a wide array of subjects is a good way to attain this. This being said, the maps and geovisualization course really appealed to my interest in attaining more knowledge. We use maps on a weekly basis in today’s society as google maps and other mapping programs have allowed people to search for whatever institution or place in which they want to travel. I personally use google maps to travel to and from surrounding food places, banks, stores, or whatever else serves my needs. This is such a big part of my life that I found it very interesting that there is a course that teaches the art of map making. I have no prior knowledge of GIS or any other software that allows for mapping and have never even considered it to be a possibility for me to learn. This is precisely why I took this course. It will allow me to gain a further understanding of how mapping works and introduce me to software that I have never before used. I am a business major and while mapping has little to do with my finance and management concentrations as I currently understand it, I think I will discover that GIS will help me in the business world. After all, I believe that an understanding of how different processes work and a further knowledge of various topics can aid in any field of study. I would like to see the correlations between business and mapping in this course and be able to apply these correlations in the future. I also think mapping is just a cool topic to have knowledge in because it has such widespread uses and not many people have an understanding of the topic. I also think the data collection piece that is involved with mapping will be useful in my field of study. Mapping requires data that is applied to maps and I hope to gain a further understanding of how to turn raw data into a useful finished product. Statistical analysis is a big part of mapping in this course so I hope to increase my skills in analysis and critical thinking by taking this course. I have always been a big history buff when it comes to how things were created and the creator’s background. I hope this course will teach me some history of map making and how it has progressed and evolved over time. I also learn best my doing hands on activities and am a visual learner. I think this course will allow me to learn about maps by creating them and using hands on activities to give me experience in map making.
Welcome to blog.richmond.edu. This is your first post. Edit or delete it, then start blogging!