
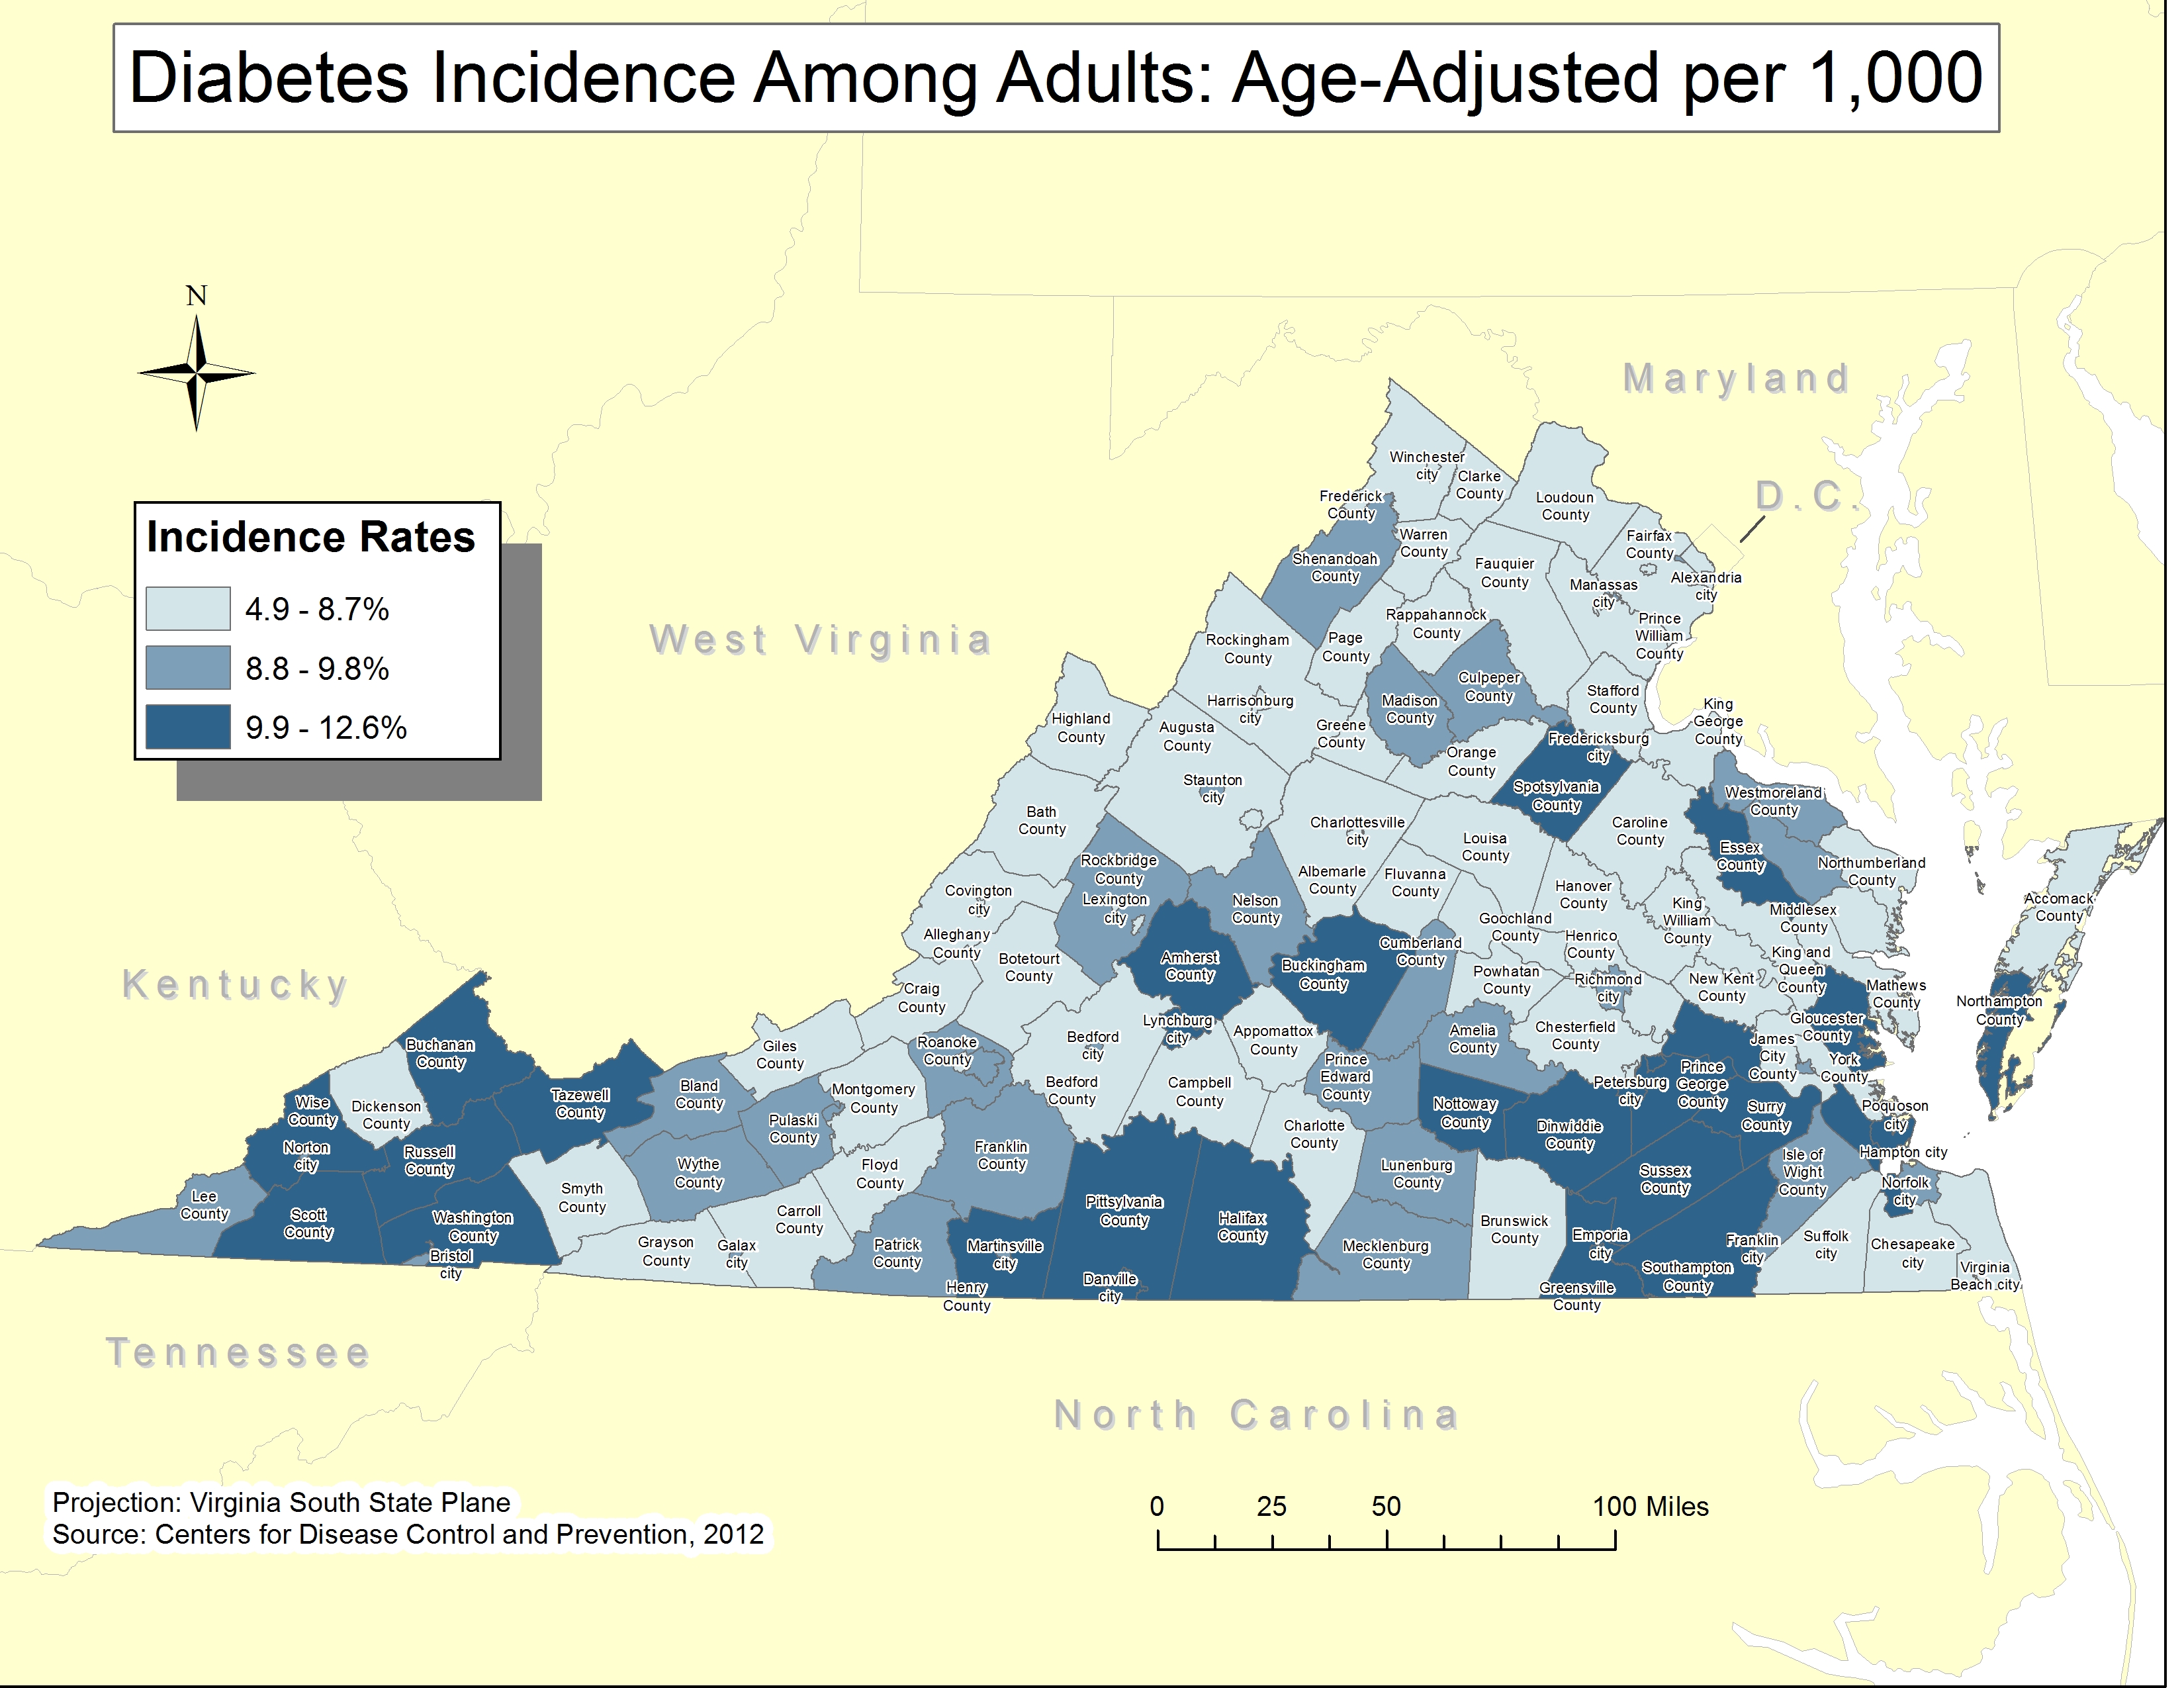
My map shows the incidence rate of diabetes among adults in the state of Virginia. The data is categorized by county, as seen by the different shades in each county, representing the incidence rate of diabetes in that county. With the average rate being 9.3% and a standard deviation of +/-.5 added, the lightest shade is below average incidence rates, with the medium and darker shades being average and above average incidence rates respectively. The incidence rates are age-adjusted per 1,000 residents, which allows the map to make a more fair comparison between counties with large age differences. For example, a county with a large amount of elderly people (likely more at risk for diabetes) would be normalized to be more fairly compared with that of a much younger aged county.