Replication in psychology

A few quick thoughts on the news that many published results in psychology can’t be replicated.

First, good for the researchers for doing this!

Second, I’ve read that R.A. Fisher, who was largely responsible for introducing the notion of using p-values to test for statistical significance, regarded the standard 5% level as merely an indication that something interesting might be going on, not as a definitive detection of an effect (although other sources seem to indicate that his views were more complicated than that). In any case, whether or not that’s what Fisher thought, it’s a good way to think of things. If you see a hypothesis confirmed with a 5% level of significance, you should think, “Hmm. Somebody should do a follow-up to see if this interesting result holds up,” rather than “Wow! It must be true, then.”

Finally, a bit of bragging about my own discipline. There’s plenty of bad work in physics, but I suspect that the particular problems that this study measured are not as bad in physics. The main reason is that in physics we do publish, and often even value, null results.

Take, for instance, attempts to detect dark matter particles. No one has ever done it, but the failed attempts to do so are not only publishable but highly respected. Here is a review article on the subject, which includes the following figure:

ns540315.f1

Every point in here is an upper limit — a record of a failed attempt to measure the number of dark matter particles.

I suspect that part of the reason we do this in physics is that we often think of our experiments primarily as measuring numbers, not testing hypotheses. Each dark matter experiment can be thought of as an attempt to measure the density of dark matter particles. Each measurement has an associated uncertainty. So far, all of those measurements have included the value zero within their error bars — that is, they have no statistically significant detection, and can’t rule out the null hypothesis that there are no dark matter particles. But if the measurement is better than previous ones — if it has smaller errors — then it’s valued.


538 on p-hacking

Christie Aschwanden has a piece on fivethirtyeight.com about the supposed “crisis” in science. She writes about recent high-profile results that turned out to be wrong, flaws in peer review, and bad statistics in published papers.

By far the best part of the article is the applet that lets you engage in your own p-hacking. It’s a great way to illustrate what p-hacking is and why it’s a problem. The idea is to take a bunch of data on performance of the US economy over time, and examine whether it has done better under Democrats or Republicans. There are multiple different measures of the economy one might choose to focus on, and multiple ways one might quantify levels of Democratic or Republican power. The applet lets you make different choices and determines whether there’s a statistically significant effect. By fiddling around for a few minutes, you can easily get a “significant” result in either direction.

Go and play around with it for a few minutes.

The rest of the article has some valuable observations, but it’s a bit of a hodgepodge. Curmudgeon that I am, I have to complain about a couple of things.

Here’s a longish quote from the article:

P-hacking is generally thought of as cheating, but what if we made it compulsory instead? If the purpose of studies is to push the frontiers of knowledge, then perhaps playing around with different methods shouldn’t be thought of as a dirty trick, but encouraged as a way of exploring boundaries. A recent project spearheaded by Brian Nosek, a founder of the nonprofit Center for Open Science, offered a clever way to do this.

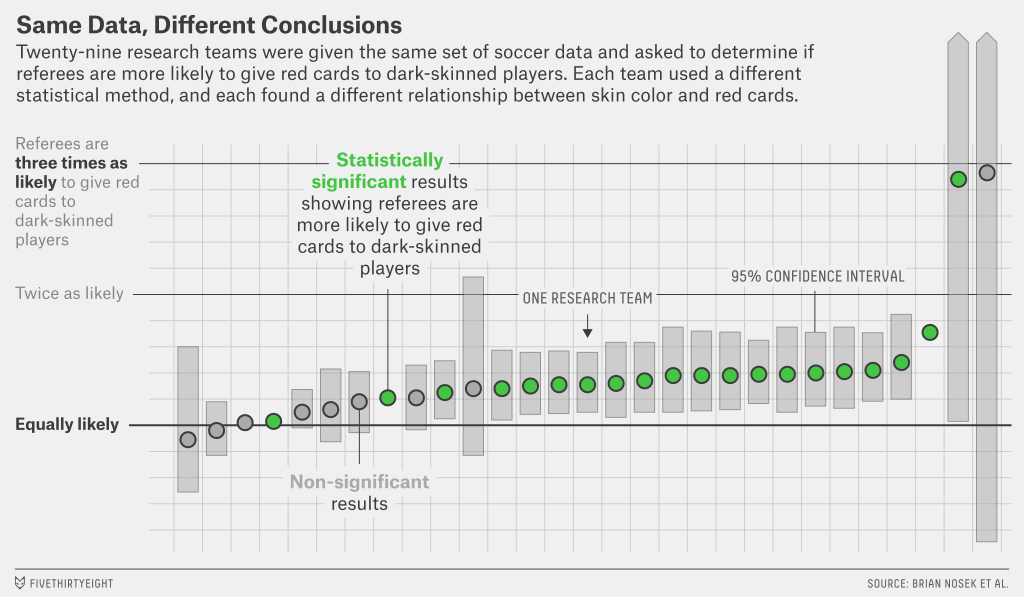
Nosek’s team invited researchers to take part in a crowdsourcing data analysis project. The setup was simple. Participants were all given the same data set and prompt: Do soccer referees give more red cards to dark-skinned players than light-skinned ones? They were then asked to submit their analytical approach for feedback from other teams before diving into the analysis.

Twenty-nine teams with a total of 61 analysts took part. The researchers used a wide variety of methods, ranging — for those of you interested in the methodological gore — from simple linear regression techniques to complex multilevel regressions and Bayesian approaches. They also made different decisions about which secondary variables to use in their analyses.

Despite analyzing the same data, the researchers got a variety of results. Twenty teams concluded that soccer referees gave more red cards to dark-skinned players, and nine teams found no significant relationship between skin color and red cards.


truth-vigilantes-soccer-calls2

The variability in results wasn’t due to fraud or sloppy work. These were highly competent analysts who were motivated to find the truth, said Eric Luis Uhlmann, a psychologist at the Insead business school in Singapore and one of the project leaders. Even the most skilled researchers must make subjective choices that have a huge impact on the result they find.

But these disparate results don’t mean that studies can’t inch us toward truth. “On the one hand, our study shows that results are heavily reliant on analytic choices,” Uhlmann told me. “On the other hand, it also suggests there’s a there there. It’s hard to look at that data and say there’s no bias against dark-skinned players.” Similarly, most of the permutations you could test in the study of politics and the economy produced, at best, only weak effects, which suggests that if there’s a relationship between the number of Democrats or Republicans in office and the economy, it’s not a strong one.

The last paragraph is simply appalling. This is precisely the sort of conclusion you can’t draw. Some methods got marginally “significant” results — if you define “significance” by the ridiculously weak 5% threshold — and others didn’t. The reason p-hacking is a problem is that people may be choosing their methods (either consciously or otherwise) to lead to their preferred conclusion. If that’s really a problem, then you can’t draw any valid conclusion from the fact that these analyses tended to go one way.

As long as I’m whining, there’s this:

Take, for instance, naive realism — the idea that whatever belief you hold, you believe it because it’s true.

Naive realism means different things to psychologists and philosophers, but this isn’t either of them.

Anyway, despite my complaining, there’s some good stuff in here.

How strong is the scientific consensus on climate change?

There is overwhelming consensus among scientists that climate change is real and is caused largely by human activity. When people want to emphasize this fact, they often cite the finding that 97% of climate scientists agree with the consensus view.

I’ve always been dubious about that claim, but in the opposite way from the climate-change skeptics: I find it hard to believe that the figure can be as low as 97%. I’m not a climate scientist myself, but whenever I talk to one, I get the impression that the consensus is much stronger than that.

97% may sound like a large number, but a scientific paradigm strongly supported by a wide variety of forms of evidence will typically garner essentially 100% consensus among experts. That’s one of the great things about science: you can gather evidence that, for all practical purposes, completely settles a question. My impression was that human-caused climate change was pretty much there.

So I was interested to see this article by James Powell, which claims that the 97% figure is a gross understatement. The author estimates the actual figure to be well over 99.9%. A few caveats: I haven’t gone over the paper in great detail, this is not my area of expertise, and the paper is still under peer review. But I find this result quite easy to believe, both because the final number sounds plausible to me and because the main methodological point in the paper strikes me as unquestionably correct.

Powell points out that the study that led to the 97% figure was derived in a way that excluded a large number of articles from consideration:


Cook et al. (2013) used the Web of Science to review the titles and abstracts of peer-reviewed articles from 1991-2011 with the keywords “global climate change” and “global warming.” With no reason to suppose otherwise, the reader assumes from the title of their article, “Quantifying the consensus on anthropogenic global warming [AGW] in the scientific literature,” that they had measured the scientific consensus on AGW using consensus in its dictionary definition and common understanding: the extent to which scientists agree with or accept the theory. But that is not how CEA used consensus.

Instead, CEA defined consensus to include only abstracts in which the authors “express[ed] an opinion on AGW (p. 1).” No matter how clearly an abstract revealed that its author accepts AGW, if it did “not address or mention the cause of global warming (p. 3),” CEA classified the abstract as having “no position” and omitted it from their calculation of the consensus. Of the 11944 articles in their database, 7930 (66.4%) were labeled as taking no position. If AGW is the ruling paradigm of climate science, as CEA set out to show, then rather than having no position, the vast majority of authors in that category must accept the theory. I return to this point below.
CEA went on to report that “Among abstracts expressing a position on AGW, 97.1% endorsed the consensus position that humans are causing global warming (p. 6, italics added).” Thus, the now widely adopted “97% consensus” refers not to what scientists accept, the conventional meaning, but to whether they used language that met the more restrictive CEA definition.

This strikes me as a completely valid critique. When there is a consensus on something, people tend not to mention it at all. Articles in physics journals pretty much never state explicitly in the abstract that, say, quantum mechanics is a good theory, or that gravity is what makes things fall.

I particularly recommend the paper’s section on plate tectonics as an explicit example of how the above methodology would lead to a false conclusion.

Let me be clear: I haven’t studied this paper enough to vouch for the complete correctness the methodology contained in it. But it looks to me like the author has made a convincing case that the 97% figure is a great understatement.